Starwood 2009 Annual Report Download - page 159
Download and view the complete annual report
Please find page 159 of the 2009 Starwood annual report below. You can navigate through the pages in the report by either clicking on the pages listed below, or by using the keyword search tool below to find specific information within the annual report.-
 1
1 -
2
-
3
-
4
-
5
-
6
-
7
-
8
-
9
-
10
-
11
-
12
-
13
-
14
-
15
-
16
-
17
-
18
-
19
-
20
-
21
-
22
-
23
-
24
-
25
-
26
-
27
-
28
-
29
-
30
-
31
-
32
-
33
-
34
-
35
-
36
-
37
-
38
-
39
-
40
-
41
-
42
-
43
-
44
-
45
-
46
-
47
-
48
-
49
-
50
-
51
-
52
-
53
-
54
-
55
-
56
-
57
-
58
-
59
-
60
-
61
-
62
-
63
-
64
-
65
-
66
-
67
-
68
-
69
-
70
-
71
-
72
-
73
-
74
-
75
-
76
-
77
-
78
-
79
-
80
-
81
-
82
-
83
-
84
-
85
-
86
-
87
-
88
-
89
-
90
-
91
-
92
-
93
-
94
-
95
-
96
-
97
-
98
-
99
-
100
-
101
-
102
-
103
-
104
-
105
-
106
-
107
-
108
-
109
-
110
-
111
-
112
-
113
-
114
-
115
-
116
-
117
-
118
-
119
-
120
-
121
-
122
-
123
-
124
-
125
-
126
-
127
-
128
-
129
-
130
-
131
-
132
-
133
-
134
-
135
-
136
-
137
-
138
-
139
-
140
-
141
-
142
-
143
-
144
-
145
-
146
-
147
-
148
-
 149
149 -
 150
150 -
 151
151 -
 152
152 -
 153
153 -
 154
154 -
 155
155 -
 156
156 -
 157
157 -
 158
158 -
 159
159 -
 160
160 -
 161
161 -
 162
162 -
 163
163 -
 164
164 -
 165
165 -
 166
166 -
 167
167 -
 168
168 -
 169
169 -
170
-
171
-
172
-
173
-
174
-
175
-
176
-
177
 |
 |

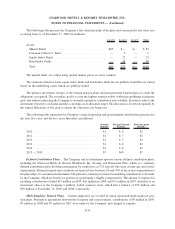
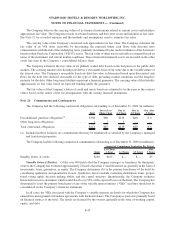
The following table presents the Company’s fair value hierarchy of the plan assets measured at fair value on a
recurring basis as of December 31, 2009 (in millions):
Level 1 Level 2 Level 3 Total
Assets:
Mutual Funds .................................... $85 $— $— $ 85
Common Collective Trusts .......................... — 5 — 5
Equity Index Funds ................................ — 22 — 22
Bond Index Funds ................................. — 48 — 48
Total ........................................... $85 $75 $— $160
The mutual funds are valued using quoted market prices in active markets.
The common collective trusts, equity index funds and bond index funds are not publicly traded but are valued
based on the underlying assets which are publicly traded.
The primary investment strategy of the foreign pension plans and postretirement benefit plan is to meet the
obligations as required. The secondary goal is to earn the highest return possible, without jeopardizing its primary
goal, and without subjecting the Company to an undue amount of contribution rate volatility. In order to achieve the
investment objectives, each plan includes a strategic asset allocation target. The allocation is reviewed regularly by
the named fiduciaries of the plan to ensure the objectives are being met.
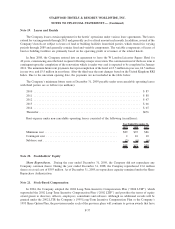
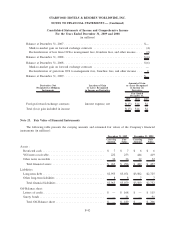
The following table represents the Company’s expected pension and postretirement benefit plan payments for
the next five years and the five years thereafter (in millions):
Pension
Benefits
Foreign Pension
Benefits
Postretirement
Benefits
2010 ........................................ $1 $ 6 $2
2011 ........................................ $1 $ 7 $2
2012 ........................................ $1 $ 7 $2
2013 ........................................ $1 $ 8 $2
2014 ........................................ $1 $ 8 $2
2015 — 2019 .................................. $7 $49 $7
Defined Contribution Plans. The Company and its subsidiaries sponsor various defined contribution plans,
including the Starwood Hotels & Resorts Worldwide, Inc. Savings and Retirement Plan, which is a voluntary
defined contribution plan allowing participation by employees on U.S. payroll who meet certain age and service
requirements. Each participant may contribute on a pretax basis between 1% and 50% of his or her compensation to
the plan subject to certain maximum limits. The plan also contains provisions for matching contributions to be made
by the Company, which are based on a portion of a participant’s eligible compensation. The amount of expense for
matching contributions totaled $15 million in 2009, $16 million in 2008 and $13 million in 2007. Included as an
investment choice is the Company’s publicly traded common stock, which had a balance of $59 million and
$30 million at December 31, 2009 and 2008, respectively.
Multi-Employer Pension Plans. Certain employees are covered by union sponsored multi-employer pen-
sion plans. Pursuant to agreements between the Company and various unions, contributions of $9 million in 2009,
$9 million in 2008 and $9 million in 2007 were made by the Company and charged to expense.
F-36
STARWOOD HOTELS & RESORTS WORLDWIDE, INC.
NOTES TO FINANCIAL STATEMENTS — (Continued)