Starwood 2009 Annual Report Download - page 103
Download and view the complete annual report
Please find page 103 of the 2009 Starwood annual report below. You can navigate through the pages in the report by either clicking on the pages listed below, or by using the keyword search tool below to find specific information within the annual report.-
 1
1 -
2
-
3
-
4
-
5
-
6
-
7
-
8
-
9
-
10
-
11
-
12
-
13
-
14
-
15
-
16
-
17
-
18
-
19
-
20
-
21
-
22
-
23
-
24
-
25
-
26
-
27
-
28
-
29
-
30
-
31
-
32
-
33
-
34
-
35
-
36
-
37
-
38
-
39
-
40
-
41
-
42
-
43
-
44
-
45
-
46
-
47
-
48
-
49
-
50
-
51
-
52
-
53
-
54
-
55
-
56
-
57
-
58
-
59
-
60
-
61
-
62
-
63
-
64
-
65
-
66
-
67
-
68
-
69
-
70
-
71
-
72
-
73
-
74
-
75
-
76
-
77
-
78
-
79
-
80
-
81
-
82
-
83
-
84
-
85
-
86
-
87
-
88
-
89
-
90
-
91
-
92
-
 93
93 -
 94
94 -
 95
95 -
 96
96 -
 97
97 -
 98
98 -
 99
99 -
 100
100 -
 101
101 -
 102
102 -
 103
103 -
 104
104 -
 105
105 -
 106
106 -
 107
107 -
 108
108 -
 109
109 -
 110
110 -
 111
111 -
 112
112 -
 113
113 -
114
-
115
-
116
-
117
-
118
-
119
-
120
-
121
-
122
-
123
-
124
-
125
-
126
-
127
-
128
-
129
-
130
-
131
-
132
-
133
-
134
-
135
-
136
-
137
-
138
-
139
-
140
-
141
-
142
-
143
-
144
-
145
-
146
-
147
-
148
-
149
-
150
-
151
-
152
-
153
-
154
-
155
-
156
-
157
-
158
-
159
-
160
-
161
-
162
-
163
-
164
-
165
-
166
-
167
-
168
-
169
-
170
-
171
-
172
-
173
-
174
-
175
-
176
-
177
 |
 |

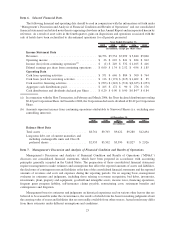
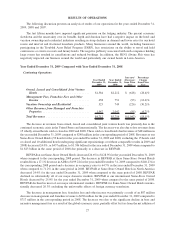
40 managed and franchised hotels to our system and approximately $15 million in termination fees recognized in
2009 when compared to $4 million in 2008.
The decrease in vacation ownership and residential sales and services was primarily due to lower originated
contract sales of VOI inventory, which represents vacation ownership revenues before adjustments for percentage of
completion accounting and other deferrals, partially offset by gains of $23 million relating to securitizations.
Originated contract sales of VOI inventory decreased 39% for the year ended December 31, 2009 when compared to
the same period in 2008. This decline was primarily driven by lower tour flow which was down 19.2% for the year
ended December 31, 2009 when compared to the same period in 2008. The decline in tour flow was a result of the
economic climate and resulting closure of underperforming sales centers. Additionally, the average contract amount
per vacation ownership unit sold decreased 21.4% to approximately $16,000, driven by a higher sales mix of lower-
priced inventory, including a higher percentage of lower-priced biennial inventory. The decrease is also due to a
$43 million decrease in residential revenue, as the 2008 period included license fees in connection with two
St. Regis projects.
Other revenues from managed and franchised properties decreased primarily due to a decrease in costs,
commensurate with the decline in revenues, at our managed and franchised hotels. These revenues represent
reimbursements of costs incurred on behalf of managed hotel and vacation ownership properties and franchisees
and relate primarily to payroll costs at managed properties where we are the employer. Since the reimbursements
are made based upon the costs incurred with no added margin, these revenues and corresponding expenses have no
effect on our operating income and our net income.
Year Ended
December 31,
2009
Year Ended
December 31,
2008
Increase/
(Decrease)
from Prior
Year
Percentage
Change
from Prior
Year
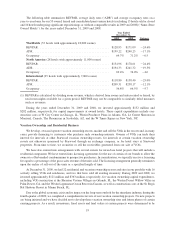
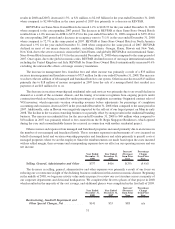
Selling, General, Administrative and Other . . $314 $377 $(63) (16.7)%
The decrease in selling, general, administrative and other expenses was primarily a result of our focus on
reducing our cost structure in the current economic climate. Beginning in the middle of 2008, we began an activity
value analysis project to review our cost structure across a majority of our corporate departments and divisional
headquarters. (See Note 13 for a summary of charges associated with this initiative.) A majority of the cost
containment initiatives were completed and implemented in late 2008 and early 2009 and are now being realized.
Costs and expenses related to our former Bliss spa business (“Bliss”) have been reclassified to discontinued
operations for both periods presented as a result of the sale of Bliss at the end of 2009.
Year Ended
December 31,
2009
Year Ended
December 31,
2008
Increase/
(Decrease)
from Prior
Year
Percentage
Change
from Prior
Year
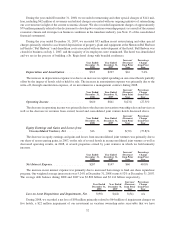
Restructuring, Goodwill Impairment and
Other Special Charges, Net ............ $379 $141 $238 n/a
During the fourth quarter of 2009, we completed a comprehensive review of our vacation ownership business.
We decided not to develop certain vacation ownership sites and future phases of certain existing projects. As a result
of these decisions, we recorded a primarily non-cash impairment charge of $255 million in the restructuring,
goodwill impairment and other special charges line item. Additionally, we recorded a $90 million non-cash charge
for the impairment of goodwill in the vacation ownership reporting unit.
Additionally, throughout 2009, we recorded restructuring and other special charges of $34 million related to
our ongoing initiative of rationalizing our cost structure. These charges related to severance charges and costs to
close vacation ownership sales galleries.
During the year ended December 31, 2008, we recorded restructuring and other special charges of $141 million,
including $62 million of severance and related charges associated with our ongoing initiative of rationalizing our cost
structure in light of the current economic climate. We also recorded impairment charges of approximately $79 million
primarily related to the decision not to develop two vacation ownership projects as a result of the economic climate and
its impact on business conditions.
28