Starwood 2009 Annual Report Download - page 43
Download and view the complete annual report
Please find page 43 of the 2009 Starwood annual report below. You can navigate through the pages in the report by either clicking on the pages listed below, or by using the keyword search tool below to find specific information within the annual report.-
 1
1 -
2
-
3
-
4
-
5
-
6
-
7
-
8
-
9
-
10
-
11
-
12
-
13
-
14
-
15
-
16
-
17
-
18
-
19
-
20
-
21
-
22
-
23
-
24
-
25
-
26
-
27
-
28
-
29
-
30
-
31
-
32
-
 33
33 -
 34
34 -
 35
35 -
 36
36 -
 37
37 -
 38
38 -
 39
39 -
 40
40 -
 41
41 -
 42
42 -
 43
43 -
 44
44 -
 45
45 -
 46
46 -
 47
47 -
 48
48 -
 49
49 -
 50
50 -
 51
51 -
 52
52 -
 53
53 -
54
-
55
-
56
-
57
-
58
-
59
-
60
-
61
-
62
-
63
-
64
-
65
-
66
-
67
-
68
-
69
-
70
-
71
-
72
-
73
-
74
-
75
-
76
-
77
-
78
-
79
-
80
-
81
-
82
-
83
-
84
-
85
-
86
-
87
-
88
-
89
-
90
-
91
-
92
-
93
-
94
-
95
-
96
-
97
-
98
-
99
-
100
-
101
-
102
-
103
-
104
-
105
-
106
-
107
-
108
-
109
-
110
-
111
-
112
-
113
-
114
-
115
-
116
-
117
-
118
-
119
-
120
-
121
-
122
-
123
-
124
-
125
-
126
-
127
-
128
-
129
-
130
-
131
-
132
-
133
-
134
-
135
-
136
-
137
-
138
-
139
-
140
-
141
-
142
-
143
-
144
-
145
-
146
-
147
-
148
-
149
-
150
-
151
-
152
-
153
-
154
-
155
-
156
-
157
-
158
-
159
-
160
-
161
-
162
-
163
-
164
-
165
-
166
-
167
-
168
-
169
-
170
-
171
-
172
-
173
-
174
-
175
-
176
-
177
 |
 |

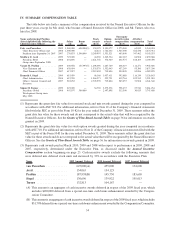
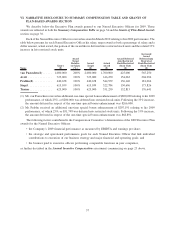
IV. SUMMARY COMPENSATION TABLE
The table below sets forth a summary of the compensation received by the Named Executive Officers for the
past three years, except for Mr. Avril, who became a Named Executive Officer in 2008, and Mr. Turner, who was
hired in 2008:
Name and principal Position
(listed alphabetically following the
Chief Executive Officer) Year
Salary
($)
Bonus
($)
Stock
awards
($)(1)
Option
awards
($)(2)
Non-equity
incentive plan
compensation
($)(3)
All other
compensation
($)(4)
Total
($)
Frits van Paasschen .......... 2009 1,000,000 600,000(5) 150,125 5,151,077 1,275,000 63,832 8,240,034
Chief Executive Officer and 2008 1,000,000 — 44,421 1,742,402 1,365,000 522,538 4,674,361
President since September 24, 2007 2007 270,833 1,500,000 5,249,997 1,331,521 403,800 347,402 9,103,553
Matthew E. Avril ............ 2009 725,000 — 44,269 1,545,324 462,187 82,908 2,859,688
President, Hotel 2008 601,896 — 2,621,756 376,360 402,375 188,103 4,190,490
Group since September 2008
Vasant M. Prabhu ........... 2009 640,658 155,393(5) 1,298,096 1,287,769 408,419 112,271 3,902,606
Vice Chairman and 2008 638,054 — 1,335,578 1,332,945 437,249 93,380 3,837,206
Chief Financial Officer 2007 617,927 — 2,312,459 715,804 550,809 85,896 4,282,895
Kenneth S. Siegel ............ 2009 615,039 — 46,166 1,957,411 392,088 116,139 3,126,843
Chief Administrative 2008 612,539 — 1,564,371 522,721 419,764 102,515 3,221,910
Officer, General Counsel and
Secretary
2007 583,232 — 2,305,559 715,804 585,037 51,908 4,241,540
Simon M. Turner ............ 2009 625,000 — 34,369 2,575,538 398,437 27,910 3,661,254
President, Global 2008 407,197 500,000 — 2,497,898 312,500 30,013 3,747,608
Development Group since
May 2008
(1) Represents the grant date fair value for restricted stock and unit awards granted during the year computed in
accordance with ASC 718. For additional information, refer to Note 21 of the Company’s financial statements
filed with the SEC as part of the Form 10-K for the year ended December 31, 2009. These amounts reflect the
grant date fair value for these awards and do not correspond to the actual value that will be recognized by the
Named Executive Officers. See the Grants of Plan-Based Awards Table on page 36 for information on awards
granted in 2009.
(2) Represents the grant date fair value for stock option awards granted during the year computed in accordance
with ASC 718. For additional information, refer to Note 21 of the Company’s financial statements filed with the
SEC as part of the Form 10-K for the year ended December 31, 2009. These amounts reflect the grant date fair
value for these awards and do not correspond to the actual value that will be recognized by the Named Executive
Officers. See the Grants of Plan-Based Awards Table on page 36 for information on awards granted in 2009.
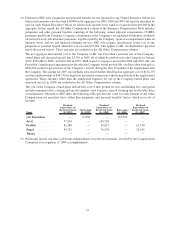
(3) Represents cash awards paid in March 2010, 2009 and 2008 with respect to performance in 2009, 2008 and
2007, respectively, determined under the Executive Plan, as discussed under the Annual Incentive
Compensation section beginning on page 23. Cash incentive awards exclude the following amounts that
were deferred into deferred stock units and increased by 33% in accordance with the Executive Plan:
Name 2009 Amount Deferred 2008 Amount Deferred 2007 Amount Deferred
van Paasschen ............. 625,000(A) 455,000 134,600
Avril ..................... 154,063 134,125 —
Prabhu ................... 187,938(B) 145,750 183,603
Siegel .................... 130,696 139,922 195,013
Turner ................... 132,813 104,167 —
(A) This amount is an aggregate of cash incentive awards deferred in respect of the 2009 fiscal year, which
includes $200,000 deferred from a special one-time cash bonus enhancement awarded by the Compen-
sation Committee.
(B) This amount is an aggregate of cash incentive awards deferred in respect of the 2009 fiscal year, which includes
$51,798 deferred from a special one-time cash bonus enhancement awarded by the Compensation Committee.
34