Starwood 2009 Annual Report Download - page 34
Download and view the complete annual report
Please find page 34 of the 2009 Starwood annual report below. You can navigate through the pages in the report by either clicking on the pages listed below, or by using the keyword search tool below to find specific information within the annual report.-
 1
1 -
2
-
3
-
4
-
5
-
6
-
7
-
8
-
9
-
10
-
11
-
12
-
13
-
14
-
15
-
16
-
17
-
18
-
19
-
20
-
21
-
22
-
23
-
 24
24 -
 25
25 -
 26
26 -
 27
27 -
 28
28 -
 29
29 -
 30
30 -
 31
31 -
 32
32 -
 33
33 -
 34
34 -
 35
35 -
 36
36 -
 37
37 -
 38
38 -
 39
39 -
 40
40 -
 41
41 -
 42
42 -
 43
43 -
 44
44 -
45
-
46
-
47
-
48
-
49
-
50
-
51
-
52
-
53
-
54
-
55
-
56
-
57
-
58
-
59
-
60
-
61
-
62
-
63
-
64
-
65
-
66
-
67
-
68
-
69
-
70
-
71
-
72
-
73
-
74
-
75
-
76
-
77
-
78
-
79
-
80
-
81
-
82
-
83
-
84
-
85
-
86
-
87
-
88
-
89
-
90
-
91
-
92
-
93
-
94
-
95
-
96
-
97
-
98
-
99
-
100
-
101
-
102
-
103
-
104
-
105
-
106
-
107
-
108
-
109
-
110
-
111
-
112
-
113
-
114
-
115
-
116
-
117
-
118
-
119
-
120
-
121
-
122
-
123
-
124
-
125
-
126
-
127
-
128
-
129
-
130
-
131
-
132
-
133
-
134
-
135
-
136
-
137
-
138
-
139
-
140
-
141
-
142
-
143
-
144
-
145
-
146
-
147
-
148
-
149
-
150
-
151
-
152
-
153
-
154
-
155
-
156
-
157
-
158
-
159
-
160
-
161
-
162
-
163
-
164
-
165
-
166
-
167
-
168
-
169
-
170
-
171
-
172
-
173
-
174
-
175
-
176
-
177
 |
 |

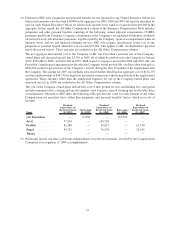
have resulted in a 200% payout. In addition, the table sets forth the approximate mid-points of payout between
the Minimum to Target and from Target to Maximum and indicates the related required performance level:
Minimum
(20%)
Mid-point
(75%)
Target(1)
(100%)
Mid-point
(150%)
Maximum
(200%)
Earnings per Share ....... $ 0.80 $ 0.90 $ 1.05 $ 1.23 $ 1.38
Company EBITDA ....... $680,000,000 $765,000,000 $862,500,000 $985,000,000 $1,094,000,000
(1) Reflects the average of the range of Target amounts: for earnings per Share, the range was $1.00 to $1.10;
for Company EBITDA, the range was $850,000,000 to 875,000,000.
For the 2009 performance period, EBITDA (which exceeded the EP Threshold) for purposes of
determining annual bonuses was $798,000,000, which reflects an adjusted EBITDA amount that is normalized
to exclude the potential impact of asset sales and/or foreign exchange swings. Actual results for earnings per
Share for purposes of determining annual bonuses were $0.985, which reflects earnings before special items.
Using the metrics described above resulted in a payout at 85% of target for the Company financial portion of
the annual bonus for the 2009 fiscal year for the Named Executive Officers.
Strategic/Operational Goals.
The strategic/operational performance goals for Named Executive Officers under the Executive Plan
consists of “Big 5” and leadership competency objectives that link individual contributions to execution of our
business strategy and major financial and operating goals. “Big 5” refers to each executive’s specific
deliverables within the Company’s critical performance categories — win with talent, execute brilliantly,
build great brands, deliver global growth, and drive outstanding results. As part of a structured process that
cascades down throughout the Company, these objectives are developed at the beginning of the year, and they
integrate and align an executive with the Company’s strategic and operational plan. Achievement of “Big 5”
objectives typically accounts for 80% of the strategic/operational performance evaluation, and achievement of
leadership competency objectives typically accounts for 20% of such evaluation. The portion of annual bonus
awards attributable to strategic/operational management performance represents 40% of Mr. van Paasschen’s
total target opportunity and 50% of the total target opportunities for the other Named Executive Officers.
Actual bonuses paid to Named Executive Officers for strategic/operational performance may range from 0% to
175% of the pre-determined target amount for this category of performance.
Evaluation Process.
In the case of Mr. van Paasschen, the Compensation Committee conducts a formal performance review
process each year during which the Compensation Committee evaluates how Mr. van Paasschen performed
against the strategic/operational/talent management performance goals established for the prior year. The
Compensation Committee also determines the extent to which the Company’s financial performance goals were
achieved and whether the Company achieved the applicable minimum threshold(s) required to pay awards.
With respect to the other Named Executive Officers, Mr. van Paasschen, together with the Chief Human
Resources Officer and with oversight and input from the Compensation Committee, conducts a formal
performance review process each year to evaluate performance against the officer’s strategic/operational
performance goals for the prior year. The Chief Executive Officer conducts this evaluation through the
Performance Management Process (“PMP”), which results in a PMP rating for each executive. This PMP
rating corresponds to a payout range under the Executive Plan determined annually by the Compensation
Committee for that rating. As noted, for 2009 the portion of the Executive Plan payouts based on PMP ratings
could range from 0% to 175% of target once the target has been adjusted to reflect the Company’s
performance. Where necessary to preserve the competitive position of the Company’s compensation scale,
the Chief Executive Officer may recommend a market adjustment to the base amount that is subjected to this
percentage. At the conclusion of his review, the Chief Executive Officer submits his recommendations to the
Compensation Committee for final review and approval. In determining the actual award payable to a Named
Executive Officer under the Executive Plan, the Compensation Committee reviews the Chief Executive
Officer’s evaluation and makes a final determination as to how the executive performed against his strategic/
25