Starwood 2009 Annual Report Download - page 171
Download and view the complete annual report
Please find page 171 of the 2009 Starwood annual report below. You can navigate through the pages in the report by either clicking on the pages listed below, or by using the keyword search tool below to find specific information within the annual report.-
 1
1 -
2
-
3
-
4
-
5
-
6
-
7
-
8
-
9
-
10
-
11
-
12
-
13
-
14
-
15
-
16
-
17
-
18
-
19
-
20
-
21
-
22
-
23
-
24
-
25
-
26
-
27
-
28
-
29
-
30
-
31
-
32
-
33
-
34
-
35
-
36
-
37
-
38
-
39
-
40
-
41
-
42
-
43
-
44
-
45
-
46
-
47
-
48
-
49
-
50
-
51
-
52
-
53
-
54
-
55
-
56
-
57
-
58
-
59
-
60
-
61
-
62
-
63
-
64
-
65
-
66
-
67
-
68
-
69
-
70
-
71
-
72
-
73
-
74
-
75
-
76
-
77
-
78
-
79
-
80
-
81
-
82
-
83
-
84
-
85
-
86
-
87
-
88
-
89
-
90
-
91
-
92
-
93
-
94
-
95
-
96
-
97
-
98
-
99
-
100
-
101
-
102
-
103
-
104
-
105
-
106
-
107
-
108
-
109
-
110
-
111
-
112
-
113
-
114
-
115
-
116
-
117
-
118
-
119
-
120
-
121
-
122
-
123
-
124
-
125
-
126
-
127
-
128
-
129
-
130
-
131
-
132
-
133
-
134
-
135
-
136
-
137
-
138
-
139
-
140
-
141
-
142
-
143
-
144
-
145
-
146
-
147
-
148
-
149
-
150
-
151
-
152
-
153
-
154
-
155
-
156
-
157
-
158
-
159
-
160
-
 161
161 -
 162
162 -
 163
163 -
 164
164 -
 165
165 -
 166
166 -
 167
167 -
 168
168 -
 169
169 -
 170
170 -
 171
171 -
 172
172 -
 173
173 -
 174
174 -
 175
175 -
 176
176 -
 177
177
 |
 |

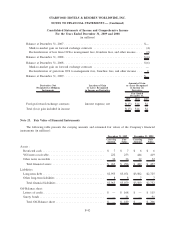
Capital expenditures:
Hotel ........................................................... $132 $282 $211
Vacation ownership and residential ..................................... 37 110 96
Corporate. . ...................................................... 27 84 77
Total . . . ...................................................... $196 $476 $384
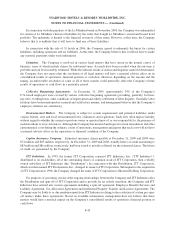
The following table presents revenues and long-lived assets by geographical region (in millions):
2009 2008 2007 2009 2008
Revenues Long-Lived Assets
United States ............................ $3,401 $4,058 $4,409 $2,334 $2,625
Italy................................... 175 370 380 399 402
All other international ..................... 1,136 1,326 1,210 1,032 1,028
Total .................................. $4,712 $5,754 $5,999 $3,765 $4,055
Other than Italy, there were no individual international countries, which comprised over 10% of the total
revenues of the Company for the years ended December 31, 2009, 2008 or 2007, or 10% of the total long-lived
assets of the Company as of December 31, 2009 or 2008.
F-48
STARWOOD HOTELS & RESORTS WORLDWIDE, INC.
NOTES TO FINANCIAL STATEMENTS — (Continued)