Starwood 2009 Annual Report Download - page 129
Download and view the complete annual report
Please find page 129 of the 2009 Starwood annual report below. You can navigate through the pages in the report by either clicking on the pages listed below, or by using the keyword search tool below to find specific information within the annual report.-
 1
1 -
2
-
3
-
4
-
5
-
6
-
7
-
8
-
9
-
10
-
11
-
12
-
13
-
14
-
15
-
16
-
17
-
18
-
19
-
20
-
21
-
22
-
23
-
24
-
25
-
26
-
27
-
28
-
29
-
30
-
31
-
32
-
33
-
34
-
35
-
36
-
37
-
38
-
39
-
40
-
41
-
42
-
43
-
44
-
45
-
46
-
47
-
48
-
49
-
50
-
51
-
52
-
53
-
54
-
55
-
56
-
57
-
58
-
59
-
60
-
61
-
62
-
63
-
64
-
65
-
66
-
67
-
68
-
69
-
70
-
71
-
72
-
73
-
74
-
75
-
76
-
77
-
78
-
79
-
80
-
81
-
82
-
83
-
84
-
85
-
86
-
87
-
88
-
89
-
90
-
91
-
92
-
93
-
94
-
95
-
96
-
97
-
98
-
99
-
100
-
101
-
102
-
103
-
104
-
105
-
106
-
107
-
108
-
109
-
110
-
111
-
112
-
113
-
114
-
115
-
116
-
117
-
118
-
 119
119 -
 120
120 -
 121
121 -
 122
122 -
 123
123 -
 124
124 -
 125
125 -
 126
126 -
 127
127 -
 128
128 -
 129
129 -
 130
130 -
 131
131 -
 132
132 -
 133
133 -
 134
134 -
 135
135 -
 136
136 -
 137
137 -
 138
138 -
 139
139 -
140
-
141
-
142
-
143
-
144
-
145
-
146
-
147
-
148
-
149
-
150
-
151
-
152
-
153
-
154
-
155
-
156
-
157
-
158
-
159
-
160
-
161
-
162
-
163
-
164
-
165
-
166
-
167
-
168
-
169
-
170
-
171
-
172
-
173
-
174
-
175
-
176
-
177
 |
 |

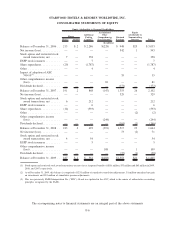
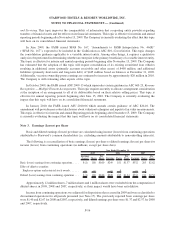
STARWOOD HOTELS & RESORTS WORLDWIDE, INC.
CONSOLIDATED STATEMENTS OF EQUITY
Shares Amount
Additional
Paid-in
Capital
(1)
Accumulated
Other
Comprehensive
(Loss) Income
(2)
Retained
Earnings
Equity
Attributable to
Noncontrolling
Interests Total
Shares
Equity Attributable to Starwood Stockholders
(In millions)
Balance at December 31, 2006 . . 213 $ 2 $ 2,286 $(228) $ 948 $25 $ 3,033
Net income (loss) ............ — — — — 542 1 543
Stock option and restricted stock
award transactions, net . . .... 7 — 358 — — — 358
ESPP stock issuances . ........ — — 7 — — — 7
Share repurchases............ (29) — (1,787) — — — (1,787)
Other .................... — — 4 — — — 4
Impact of adoption of ASC
740-10
(3)
................ — — — — 35 — 35
Other comprehensive income
(loss) . . . ................ — — — 81 — — 81
Dividends declared . . . ........ — — — — (172) — (172)
Balance at December 31, 2007 . . 191 2 868 (147) 1,353 26 2,102
Net income (loss) ............ — — — — 329 — 329
Stock option and restricted stock
award transactions, net . . .... 6 — 212 — — — 212
ESPP stock issuances . ........ — — 6 — — — 6
Share repurchases............ (14) — (593) — — — (593)
Other .................... — — — — — (2) (2)
Other comprehensive income
(loss) . . . ................ — — — (244) — — (244)
Dividends declared . . . ........ — — — — (165) (1) (166)
Balance at December 31, 2008 . . 183 2 493 (391) 1,517 23 1,644
Net income (loss) ............ — — — — 73 (2) 71
Stock option and restricted stock
award transactions, net . . .... 4 — 54 — — — 54
ESPP stock issuances . ........ — — 5 — — — 5
Other comprehensive income
(loss) . . . ................ — — — 108 — 1 109
Dividends declared . . . ........ — — — — (37) (1) (38)
Balance at December 31, 2009 . . 187 $ 2 $ 552 $(283) $1,553 $21 $ 1,845
(1) Stock option and restricted stock award transactions are net of a tax (expense) benefit of ($18) million, $33 million and $65 million in 2009,
2008, and 2007 respectively.
(2) As of December 31, 2009, this balance is comprised of $231 million of cumulative translation adjustments, $1 million unrealized net gain
on investments and $53 million of cumulative pension adjustments.
(3) This was previously FASB Interpretation No. (“FIN”) 48 and was updated in the ASC, which is the source of authoritative accounting
principles recognized by the FASB.
The accompanying notes to financial statements are an integral part of the above statements
F-6