Starwood 2009 Annual Report Download - page 108
Download and view the complete annual report
Please find page 108 of the 2009 Starwood annual report below. You can navigate through the pages in the report by either clicking on the pages listed below, or by using the keyword search tool below to find specific information within the annual report.-
 1
1 -
2
-
3
-
4
-
5
-
6
-
7
-
8
-
9
-
10
-
11
-
12
-
13
-
14
-
15
-
16
-
17
-
18
-
19
-
20
-
21
-
22
-
23
-
24
-
25
-
26
-
27
-
28
-
29
-
30
-
31
-
32
-
33
-
34
-
35
-
36
-
37
-
38
-
39
-
40
-
41
-
42
-
43
-
44
-
45
-
46
-
47
-
48
-
49
-
50
-
51
-
52
-
53
-
54
-
55
-
56
-
57
-
58
-
59
-
60
-
61
-
62
-
63
-
64
-
65
-
66
-
67
-
68
-
69
-
70
-
71
-
72
-
73
-
74
-
75
-
76
-
77
-
78
-
79
-
80
-
81
-
82
-
83
-
84
-
85
-
86
-
87
-
88
-
89
-
90
-
91
-
92
-
93
-
94
-
95
-
96
-
97
-
 98
98 -
 99
99 -
 100
100 -
 101
101 -
 102
102 -
 103
103 -
 104
104 -
 105
105 -
 106
106 -
 107
107 -
 108
108 -
 109
109 -
 110
110 -
 111
111 -
 112
112 -
 113
113 -
 114
114 -
 115
115 -
 116
116 -
 117
117 -
 118
118 -
119
-
120
-
121
-
122
-
123
-
124
-
125
-
126
-
127
-
128
-
129
-
130
-
131
-
132
-
133
-
134
-
135
-
136
-
137
-
138
-
139
-
140
-
141
-
142
-
143
-
144
-
145
-
146
-
147
-
148
-
149
-
150
-
151
-
152
-
153
-
154
-
155
-
156
-
157
-
158
-
159
-
160
-
161
-
162
-
163
-
164
-
165
-
166
-
167
-
168
-
169
-
170
-
171
-
172
-
173
-
174
-
175
-
176
-
177
 |
 |

previously securitized, and an $11 million write-off of our investment in a joint venture in which we hold minority
interest (see Note 5 of the consolidated financial statements).
During 2007, we recorded a net loss of $44 million primarily related to a net loss of $58 million on the sale of
eight wholly-owned hotels and a loss of approximately $7 million primarily related to charges at three other
properties. These losses were offset in part by $20 million of net gains primarily on the sale of assets in which we
held a minority interest and a gain of $6 million as a result of insurance proceeds received for property damage
caused by storms at two owned hotels in prior years.
Year Ended
December 31,
2008
Year Ended
December 31,
2007
Increase/
(Decrease)
from Prior
Year
Percentage
Change
from Prior
Year
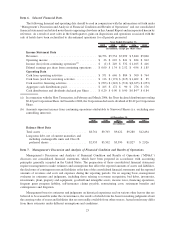
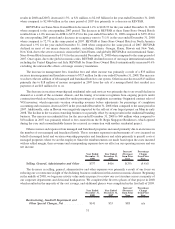
Income Tax Expense ................... $72 $183 $(111) (60.7)%
The decrease in income tax expense is primarily related to a decrease in pretax income and certain other one
time tax benefits. The effective tax rate decreased to 23.0% in the year ended December 31, 2008 as compared to
25.8% in 2007. The 2008 tax rate was favorably impacted by a $31 million benefit related to the reversal of capital
and net operating loss valuation allowances, a $20 million benefit related to lower foreign taxes, and a $14 million
benefit associated with tax on the repatriation of foreign earnings. These benefits were partially offset by a
$16 million charge for the basis difference on certain asset sales and a $7 million charge related to amortization of
prepaid taxes in connection with certain related party transactions during 2008. The 2007 expense was favorably
impacted by a $158 million benefit related to the reversal of capital and net operating loss valuation allowances and
a $28 million benefit associated with our election to claim foreign tax credits generated in 1999 and 2000. Offsetting
these benefits in 2007 were a $97 million charge associated with adjustments to the tax benefit from the Host
Transaction and a $13 million charge associated with changes in uncertain tax positions.
Discontinued Operations, Net of Tax
For the year ended December 31, 2008, the gain on dispositions includes a $124 million gain ($129 million pre
tax) on the sale of three properties which were sold unencumbered by management or franchise contracts.
Additionally, in 2009, $5 million was reclassified to discontinued operations (in the 2008 results) relating to two
hotels that were in the process of being sold at the end of 2009. Discontinued operations for the year ended
December 31, 2008 also includes a $49 million tax charge as a result of a 2008 administrative tax ruling for an
unrelated taxpayer, that impacts the tax liability associated with the disposition of one of our businesses several
years ago.
For the year ended December 31, 2007, the income from discontinued operations represents $11 million (net of
tax) of 2007 results from operations relating to Bliss and the two hotels that were in the process of being sold at
December 31, 2009 and that were reclassified to discontinued operations. The loss on disposition includes a
$1 million tax assessment associated with the disposition of the Company’s former gaming business in 1999.
LIQUIDITY AND CAPITAL RESOURCES
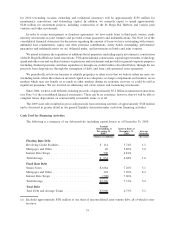
Cash From Operating Activities
Cash flow from operating activities is generated primarily from management and franchise revenues,
operating income from our owned hotels and sales of VOIs and residential units. Other sources of cash are
distributions from joint-ventures, servicing financial assets and interest income. These are the principal sources of
cash used to fund our operating expenses, interest payments on debt, capital expenditures, dividend payments,
property and income taxes and share repurchases. We believe that our existing borrowing availability together with
capacity for additional borrowings and cash from operations will be adequate to meet all funding requirements for
our operating expenses, principal and interest payments on debt, capital expenditures, dividend payments and share
repurchases in the foreseeable future.
The majority of our cash flow is derived from corporate and leisure travelers and is dependent on the supply
and demand in the lodging industry. In a recessionary economy, we experience significant declines in business and
33