Starwood 2009 Annual Report Download - page 102
Download and view the complete annual report
Please find page 102 of the 2009 Starwood annual report below. You can navigate through the pages in the report by either clicking on the pages listed below, or by using the keyword search tool below to find specific information within the annual report.-
 1
1 -
2
-
3
-
4
-
5
-
6
-
7
-
8
-
9
-
10
-
11
-
12
-
13
-
14
-
15
-
16
-
17
-
18
-
19
-
20
-
21
-
22
-
23
-
24
-
25
-
26
-
27
-
28
-
29
-
30
-
31
-
32
-
33
-
34
-
35
-
36
-
37
-
38
-
39
-
40
-
41
-
42
-
43
-
44
-
45
-
46
-
47
-
48
-
49
-
50
-
51
-
52
-
53
-
54
-
55
-
56
-
57
-
58
-
59
-
60
-
61
-
62
-
63
-
64
-
65
-
66
-
67
-
68
-
69
-
70
-
71
-
72
-
73
-
74
-
75
-
76
-
77
-
78
-
79
-
80
-
81
-
82
-
83
-
84
-
85
-
86
-
87
-
88
-
89
-
90
-
91
-
 92
92 -
 93
93 -
 94
94 -
 95
95 -
 96
96 -
 97
97 -
 98
98 -
 99
99 -
 100
100 -
 101
101 -
 102
102 -
 103
103 -
 104
104 -
 105
105 -
 106
106 -
 107
107 -
 108
108 -
 109
109 -
 110
110 -
 111
111 -
 112
112 -
113
-
114
-
115
-
116
-
117
-
118
-
119
-
120
-
121
-
122
-
123
-
124
-
125
-
126
-
127
-
128
-
129
-
130
-
131
-
132
-
133
-
134
-
135
-
136
-
137
-
138
-
139
-
140
-
141
-
142
-
143
-
144
-
145
-
146
-
147
-
148
-
149
-
150
-
151
-
152
-
153
-
154
-
155
-
156
-
157
-
158
-
159
-
160
-
161
-
162
-
163
-
164
-
165
-
166
-
167
-
168
-
169
-
170
-
171
-
172
-
173
-
174
-
175
-
176
-
177
 |
 |

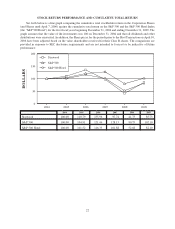
RESULTS OF OPERATIONS
The following discussion presents an analysis of results of our operations for the years ended December 31,
2009, 2008 and 2007.
The last fifteen months have imposed significant pressures on the lodging industry. The present economic
slowdown and the uncertainty over its breadth, depth and duration have had a negative impact on the hotel and
vacation ownership and residential industries resulting in steep declines in demand and lower rates for our hotel
rooms and interval and fractional timeshare products. Many businesses around the world, including businesses
participating in the Troubled Asset Relief Program (TARP), face restrictions on the ability to travel and hold
conferences or events at resorts and luxury hotels. The negative publicity associated with such companies holding
large events has resulted in cancellations and reduced bookings. In addition, the H1N1 (Swine Flu) virus has
negatively impacted our business around the world and particularly our owned hotels in Latin America.
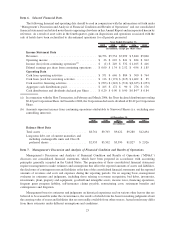
Year Ended December 31, 2009 Compared with Year Ended December 31, 2008
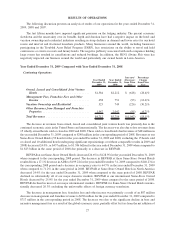
Continuing Operations
Year Ended
December 31,
2009
Year Ended
December 31,
2008
Increase/
(Decrease)
from Prior
Year
Percentage
Change
from Prior
Year
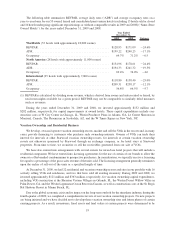
Owned, Leased and Consolidated Joint Venture
Hotels ................................ $1,584 $2,212 $ (628) (28.4)%
Management Fees, Franchise Fees and Other
Income ............................... 658 751 (93) (12.4)%
Vacation Ownership and Residential ........... 523 749 (226) (30.2)%
Other Revenues from Managed and Franchise
Properties ............................. 1,947 2,042 (95) (4.7)%
Total Revenues ........................... $4,712 $5,754 $(1,042) (18.1)%
The decrease in revenues from owned, leased and consolidated joint venture hotels was primarily due to the
continued economic crisis in the United States and internationally. The decrease was also due to lost revenues from
15 wholly owned hotels sold or closed in 2009 and 2008. These sold or closed hotels had revenues of $68 million in
the year ended December 31, 2009 compared to $248 million in the corresponding period of 2008. Revenues at our
Same-Store Owned Hotels (53 hotels for the year ended December 31, 2009 and 2008, excluding the 15 hotels sold
or closed and 10 additional hotels undergoing significant repositionings or without comparable results in 2009 and
2008) decreased 24.0%, or $437 million, to $1.386 billion for the year ended December 31, 2009 when compared to
$1.823 billion in the same period of 2008 due primarily to a decrease in REVPAR.
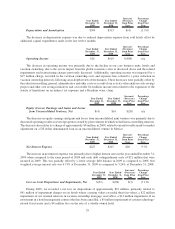
REVPAR at our Same-Store Owned Hotels decreased 24.6% to $128.95 for the year ended December 31, 2009
when compared to the corresponding 2008 period. The decrease in REVPAR at these Same-Store Owned Hotels
resulted from a 17.1% decrease in ADR to $199.22 for the year ended December 31, 2009 compared to $240.23 for
the corresponding 2008 period and a decrease in occupancy rates to 64.7% in the year ended December 31, 2009
when compared to 71.2% in the same period in 2008. REVPAR at Same-Store Owned Hotels in North America
decreased 24.4% for the year ended December 31, 2009 when compared to the same period of 2008. REVPAR
declined in substantially all of our major domestic markets. REVPAR at our international Same-Store Owned
Hotels decreased by 25.0% for the year ended December 31, 2009 when compared to the same period of 2008.
REVPAR declined in most of our major international markets. REVPAR for Same-Store Owned Hotels interna-
tionally decreased 20.3% excluding the unfavorable effects of foreign currency translation.
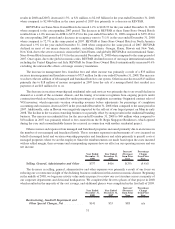
The decrease in management fees, franchise fees and other income was primarily a result of an $87 million
decrease in management and franchise revenue to $630 million for the year ended December 31, 2009 compared to
$717 million in the corresponding period in 2008. The decrease was due to the significant decline in base and
incentive management fees as a result of the global economic crisis, partially offset by fees from the net addition of
27