Starwood 2009 Annual Report Download - page 127
Download and view the complete annual report
Please find page 127 of the 2009 Starwood annual report below. You can navigate through the pages in the report by either clicking on the pages listed below, or by using the keyword search tool below to find specific information within the annual report.-
 1
1 -
2
-
3
-
4
-
5
-
6
-
7
-
8
-
9
-
10
-
11
-
12
-
13
-
14
-
15
-
16
-
17
-
18
-
19
-
20
-
21
-
22
-
23
-
24
-
25
-
26
-
27
-
28
-
29
-
30
-
31
-
32
-
33
-
34
-
35
-
36
-
37
-
38
-
39
-
40
-
41
-
42
-
43
-
44
-
45
-
46
-
47
-
48
-
49
-
50
-
51
-
52
-
53
-
54
-
55
-
56
-
57
-
58
-
59
-
60
-
61
-
62
-
63
-
64
-
65
-
66
-
67
-
68
-
69
-
70
-
71
-
72
-
73
-
74
-
75
-
76
-
77
-
78
-
79
-
80
-
81
-
82
-
83
-
84
-
85
-
86
-
87
-
88
-
89
-
90
-
91
-
92
-
93
-
94
-
95
-
96
-
97
-
98
-
99
-
100
-
101
-
102
-
103
-
104
-
105
-
106
-
107
-
108
-
109
-
110
-
111
-
112
-
113
-
114
-
115
-
116
-
 117
117 -
 118
118 -
 119
119 -
 120
120 -
 121
121 -
 122
122 -
 123
123 -
 124
124 -
 125
125 -
 126
126 -
 127
127 -
 128
128 -
 129
129 -
 130
130 -
 131
131 -
 132
132 -
 133
133 -
 134
134 -
 135
135 -
 136
136 -
 137
137 -
138
-
139
-
140
-
141
-
142
-
143
-
144
-
145
-
146
-
147
-
148
-
149
-
150
-
151
-
152
-
153
-
154
-
155
-
156
-
157
-
158
-
159
-
160
-
161
-
162
-
163
-
164
-
165
-
166
-
167
-
168
-
169
-
170
-
171
-
172
-
173
-
174
-
175
-
176
-
177
 |
 |

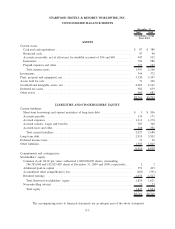
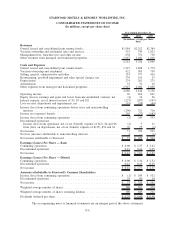
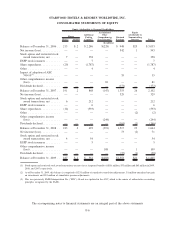
STARWOOD HOTELS & RESORTS WORLDWIDE, INC.
CONSOLIDATED STATEMENTS OF INCOME
(In millions, except per share data)
2009 2008 2007
Year Ended December 31,
(In millions, except per share
data)
Revenues
Owned, leased and consolidated joint venture hotels. . . . . . . . . . . . . . . . . . . . . . . $1,584 $2,212 $2,384
Vacation ownership and residential sales and services . . . . . . . . . . . . . . . . . . . . . . 523 749 1,025
Management fees, franchise fees and other income. . . . . . . . . . . . . . . . . . . . . . . . 658 751 730
Other revenues from managed and franchised properties. . . . . . . . . . . . . . . . . . . . 1,947 2,042 1,860
4,712 5,754 5,999
Costs and Expenses
Owned, leased and consolidated joint venture hotels. . . . . . . . . . . . . . . . . . . . . . . 1,315 1,688 1,774
Vacation ownership and residential . . . . . . . . . . . . . . . . . . . . . . . . . . . . . . . . . . . 422 583 758
Selling, general, administrative and other . . . . . . . . . . . . . . . . . . . . . . . . . . . . . . . 314 377 416
Restructuring, goodwill impairment and other special charges, net . . . . . . . . . . . . 379 141 53
Depreciation . . . . . . . . . . . . . . . . . . . . . . . . . . . . . . . . . . . . . . . . . . . . . . . . . . . . 274 281 271
Amortization . . . . . . . . . . . . . . . . . . . . . . . . . . . . . . . . . . . . . . . . . . . . . . . . . . . 35 32 26
Other expenses from managed and franchised properties . . . . . . . . . . . . . . . . . . . 1,947 2,042 1,860
4,686 5,144 5,158
Operating income . . . . . . . . . . . . . . . . . . . . . . . . . . . . . . . . . . . . . . . . . . . . . . . . 26 610 841
Equity (losses) earnings and gains and losses from unconsolidated ventures, net . . (4) 16 66
Interest expense, net of interest income of $3, $3 and $21 . . . . . . . . . . . . . . . . . . (227) (207) (147)
Loss on asset dispositions and impairments, net . . . . . . . . . . . . . . . . . . . . . . . . . . (91) (98) (44)
Income (loss) from continuing operations before taxes and noncontrolling
interests . . . . . . . . . . . . . . . . . . . . . . . . . . . . . . . . . . . . . . . . . . . . . . . . . . . . . (296) 321 716
Income tax (expense) benefit . . . . . . . . . . . . . . . . . . . . . . . . . . . . . . . . . . . . . . . . 293 (72) (183)
Income (loss) from continuing operations . . . . . . . . . . . . . . . . . . . . . . . . . . . . . . (3) 249 533
Discontinued operations:
Income (loss) from operations, net of tax (benefit) expense of $(2), $4 and $6. . (2) 5 11
Gain (loss) on dispositions, net of tax (benefit) expense of $(35), $54 and $1 . . 76 75 (1)
Net income. . . . . . . . . . . . . . . . . . . . . . . . . . . . . . . . . . . . . . . . . . . . . . . . . . . . . 71 329 543
Net loss (income) attributable to noncontrolling interests . . . . . . . . . . . . . . . . . . . 2 — (1)
Net income attributable to Starwood . . . . . . . . . . . . . . . . . . . . . . . . . . . . . . . . . . $ 73 $ 329 $ 542
Earnings (Losses) Per Share — Basic
Continuing operations . . . . . . . . . . . . . . . . . . . . . . . . . . . . . . . . . . . . . . . . . . . . . $ 0.00 $ 1.37 $ 2.62
Discontinued operations . . . . . . . . . . . . . . . . . . . . . . . . . . . . . . . . . . . . . . . . . . . 0.41 0.44 0.05
Net income. . . . . . . . . . . . . . . . . . . . . . . . . . . . . . . . . . . . . . . . . . . . . . . . . . . . . $ 0.41 $ 1.81 $ 2.67
Earnings (Losses) Per Share — Diluted
Continuing operations . . . . . . . . . . . . . . . . . . . . . . . . . . . . . . . . . . . . . . . . . . . . . $ 0.00 $ 1.34 $ 2.52
Discontinued operations . . . . . . . . . . . . . . . . . . . . . . . . . . . . . . . . . . . . . . . . . . . 0.41 0.43 0.05
Net income. . . . . . . . . . . . . . . . . . . . . . . . . . . . . . . . . . . . . . . . . . . . . . . . . . . . . $ 0.41 $ 1.77 $ 2.57
Amounts attributable to Starwood’s Common Shareholders
Income (loss) from continuing operations . . . . . . . . . . . . . . . . . . . . . . . . . . . . . . $ (1) $ 249 $ 532
Discontinued operations . . . . . . . . . . . . . . . . . . . . . . . . . . . . . . . . . . . . . . . . . . . 74 80 10
Net income. . . . . . . . . . . . . . . . . . . . . . . . . . . . . . . . . . . . . . . . . . . . . . . . . . . . . $ 73 $ 329 $ 542
Weighted average number of shares . . . . . . . . . . . . . . . . . . . . . . . . . . . . . . . . . . . 180 181 203
Weighted average number of shares assuming dilution . . . . . . . . . . . . . . . . . . . . . 180 185 211
Dividends declared per share . . . . . . . . . . . . . . . . . . . . . . . . . . . . . . . . . . . . . . . . $ 0.20 $ 0.90 $ 0.90
The accompanying notes to financial statements are an integral part of the above statements
F-4