Starwood 2009 Annual Report Download - page 106
Download and view the complete annual report
Please find page 106 of the 2009 Starwood annual report below. You can navigate through the pages in the report by either clicking on the pages listed below, or by using the keyword search tool below to find specific information within the annual report.-
 1
1 -
2
-
3
-
4
-
5
-
6
-
7
-
8
-
9
-
10
-
11
-
12
-
13
-
14
-
15
-
16
-
17
-
18
-
19
-
20
-
21
-
22
-
23
-
24
-
25
-
26
-
27
-
28
-
29
-
30
-
31
-
32
-
33
-
34
-
35
-
36
-
37
-
38
-
39
-
40
-
41
-
42
-
43
-
44
-
45
-
46
-
47
-
48
-
49
-
50
-
51
-
52
-
53
-
54
-
55
-
56
-
57
-
58
-
59
-
60
-
61
-
62
-
63
-
64
-
65
-
66
-
67
-
68
-
69
-
70
-
71
-
72
-
73
-
74
-
75
-
76
-
77
-
78
-
79
-
80
-
81
-
82
-
83
-
84
-
85
-
86
-
87
-
88
-
89
-
90
-
91
-
92
-
93
-
94
-
95
-
 96
96 -
 97
97 -
 98
98 -
 99
99 -
 100
100 -
 101
101 -
 102
102 -
 103
103 -
 104
104 -
 105
105 -
 106
106 -
 107
107 -
 108
108 -
 109
109 -
 110
110 -
 111
111 -
 112
112 -
 113
113 -
 114
114 -
 115
115 -
 116
116 -
117
-
118
-
119
-
120
-
121
-
122
-
123
-
124
-
125
-
126
-
127
-
128
-
129
-
130
-
131
-
132
-
133
-
134
-
135
-
136
-
137
-
138
-
139
-
140
-
141
-
142
-
143
-
144
-
145
-
146
-
147
-
148
-
149
-
150
-
151
-
152
-
153
-
154
-
155
-
156
-
157
-
158
-
159
-
160
-
161
-
162
-
163
-
164
-
165
-
166
-
167
-
168
-
169
-
170
-
171
-
172
-
173
-
174
-
175
-
176
-
177
 |
 |

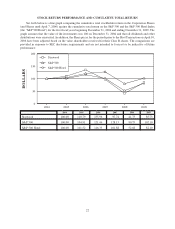
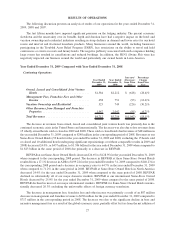
results in 2008 and 2007) decreased 1.5%, or $31 million, to $2.015 billion for the year ended December 31, 2008
when compared to $2.046 billion in the same period of 2007 due primarily to a decrease in REVPAR.
REVPAR at our Same-Store Owned Hotels decreased 1.2% to $168.93 for the year ended December 31, 2008
when compared to the corresponding 2007 period. The decrease in REVPAR at these Same-Store Owned Hotels
resulted from a 1.0% increase in ADR to $237.45 for the year ended December 31, 2008 compared to $235.18 for
the corresponding 2007 period and a decrease in occupancy rates to 71.1% in the year ended December 31, 2008
when compared to 72.7% in the same period in 2007. REVPAR at Same-Store Owned Hotels in North America
decreased 1.9% for the year ended December 31, 2008 when compared to the same period of 2007. REVPAR
declined in most of our major domestic markets, including Atlanta, Georgia, Kauai, Hawaii and New York,
New York, due to the severe economic crisis in the United States, and globally. REVPAR at our international Same-
Store Owned Hotels increased by 0.1% for the year ended December 31, 2008 when compared to the same period of
2007. Once again, due to the global economic crisis, REVPAR declined in most of our major international markets,
including the United Kingdom and Italy. REVPAR for Same-Store Owned Hotels internationally increased 0.6%
excluding the unfavorable effects of foreign currency translation.
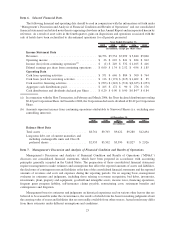
The increase in management fees, franchise fees and other income was primarily a result of a $35 million
increase in management and franchise revenue to $717 million for the year ended December 31, 2008. The increase
was due to the net addition of 48 managed and franchised hotels to our system. Other income decreased $13 million
primarily due to $18 million of income recognized in 2007 from the sale of a managed hotel that resulted in a
payment of an $18 million fee to us.
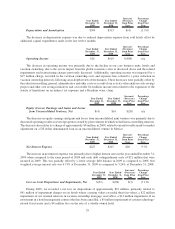
The decrease in vacation ownership and residential sales and services was primarily due to an overall decline in
demand as a result of the economic climate, and the timing of revenue recognition from ongoing projects under
construction which are being accounted for under percentage of completion accounting. Originated contract sales of
VOI inventory, which represents vacation ownership revenues before adjustments for percentage of completion
accounting and rescission, decreased 26% in the year ended December 31, 2008 when compared to the same period in
2007. Additionally, sales in Hawaii were negatively impacted by the sell out of our largest project on Maui in early
2008. The decline in the vacation ownership business was partially offset by strong results in the residential branding
business. The increase in residential fees for the year ended December 31, 2008 to $49 million when compared to
$18 million in 2007 was primarily related to fees earned from the St. Regis Singapore Residences, which opened
during the year and a nonrefundable license fee received in connection with another residential project.
Other revenues and expenses from managed and franchised properties increased primarily due to an increase in
the number of our managed and franchised hotels. These revenues represent reimbursements of costs incurred on
behalf of managed hotel and vacation ownership properties and franchisees and relate primarily to payroll costs at
managed properties where we are the employer. Since the reimbursements are made based upon the costs incurred
with no added margin, these revenues and corresponding expenses have no effect on our operating income and our
net income.
Year Ended
December 31,
2008
Year Ended
December 31,
2007
Increase/
(Decrease)
from Prior
Year
Percentage
Change
from Prior
Year
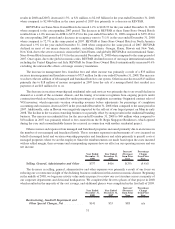
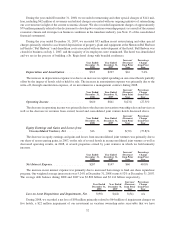
Selling, General, Administrative and Other . . $377 $416 $(39) (9.4)%
The decrease in selling, general, administrative and other expenses was primarily a result of our focus on
reducing our cost structure in light of the declining business conditions in this current economic climate. Beginning
in the middle of 2008, we began an activity value analysis project to review our cost structure across a majority of
our corporate departments and divisional headquarters. We completed the first two phases of that project in 2008
which resulted in the majority of the cost savings, and additional phases were completed in the first half of 2009.
Year Ended
December 31,
2008
Year Ended
December 31,
2007
Increase/
(Decrease)
from Prior
Year
Percentage
Change
from Prior
Year
Restructuring, Goodwill Impairment and
Other Special Charges, Net ............ $141 $53 $88 n/a
31