Samsung 2014 Annual Report Download - page 99
Download and view the complete annual report
Please find page 99 of the 2014 Samsung annual report below. You can navigate through the pages in the report by either clicking on the pages listed below, or by using the keyword search tool below to find specific information within the annual report.-
 1
1 -
2
-
3
-
4
-
5
-
6
-
7
-
8
-
9
-
10
-
11
-
12
-
13
-
14
-
15
-
16
-
17
-
18
-
19
-
20
-
21
-
22
-
23
-
24
-
25
-
26
-
27
-
28
-
29
-
30
-
31
-
32
-
33
-
34
-
35
-
36
-
37
-
38
-
39
-
40
-
41
-
42
-
43
-
44
-
45
-
46
-
47
-
48
-
49
-
50
-
51
-
52
-
53
-
54
-
55
-
56
-
57
-
58
-
59
-
60
-
61
-
62
-
63
-
64
-
65
-
66
-
67
-
68
-
69
-
70
-
71
-
72
-
73
-
74
-
75
-
76
-
77
-
78
-
79
-
80
-
81
-
82
-
83
-
84
-
85
-
86
-
87
-
88
-
 89
89 -
 90
90 -
 91
91 -
 92
92 -
 93
93 -
 94
94 -
 95
95 -
 96
96 -
 97
97 -
 98
98 -
 99
99 -
 100
100 -
 101
101 -
 102
102 -
 103
103 -
 104
104 -
 105
105 -
 106
106 -
 107
107 -
 108
108 -
 109
109 -
110
-
111
-
112
-
113
-
114
 |
 |

097096
2014 Samsung Electronics Annual Report2014 Samsung Electronics Annual Report
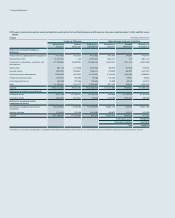
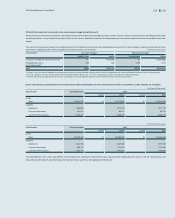
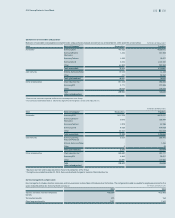
(2) The following table presents the assets and liabilities, by level, that are measured at fair value: (In millions of Korean won)
2014
Level 1 Level 2 Level 3 Total balance
1) Assets
Short-term available-for-sale financial assets ₩1,016,878 ₩2,269,920 ₩- ₩3,286,798
Long-term available-for-sale financial assets15,776,836 3,050,338 3,445,582 12,272,756
Other - 45,898 102,513 148,411
2) Liabilities
Derivatives - 78,348 - 78,348
(In millions of Korean won)
2013
Level 1 Level 2 Level 3 Total balance
1) Assets
Short-term available-for-sale financial assets ₩1,257,492 ₩231,035 ₩- ₩1,488,527
Long-term available-for-sale financial assets14,399,314 957,463 493,378 5,850,155
Other - 40,552 - 40,552
2) Liabilities
Derivatives - 244,172 - 244,172
1 Amount measured at cost (2014: KRW 394,753 million, 2013: KRW 388,225 million) is excluded as the range of reasonable fair value estimates is significant and the probabilities of the various estimates
cannot be reasonably assessed.
The levels of the fair value hierarchy and its application to financial assets and liabilities are described below.
• Level 1: Quoted prices (unadjusted) in active markets for identical assets or liabilities
• Level 2: Inputs other than quoted prices included within Level 1 that are observable for the asset or liability, either directly or indirectly
• Level 3: Inputs for the asset or liability that are not based on observable market data (that is, unobservable inputs)
The fair value of financial instruments traded in active markets is based on quoted market prices at the statement of financial position date. A market is regarded as active if
quoted prices are readily and regularly available from an exchange, dealer, broker, industry group, pricing service, or regulatory agency, and those prices represent actual and
regularly occurring market transactions on an arm’s length basis. The quoted market price used for financial assets held by the Group is the current bid price. These instruments
are included in Level 1. Instruments included in Level 1 are listed equity investments classified as trading securities or available-for-sale financial assets.
The fair value of financial instruments that are not traded in an active market (for example, over-the-counter derivatives) is determined by using valuation techniques. These val-
uation techniques maximize the use of observable market data where it is available and rely as little as possible on entity specific estimates. If all significant inputs required to fair
value an instrument are observable, the instrument is included in Level 2.
If one or more of the significant inputs are not based on observable market data, the instrument is included in Level 3.
Specific valuation techniques used to value financial instruments include:
- Quoted market prices or dealer quotes for similar instruments.
- The fair value of forward foreign exchange contracts is determined using forward exchange rates at the statement of financial position date, with the resulting value discounted
back to present value.
Other techniques, such as discounted cash flow analysis, are used to determine fair value for the remaining financial instruments. For trade and other receivables, the book val-
ue approximates a reasonable estimate of fair value.