Samsung 2014 Annual Report Download - page 100
Download and view the complete annual report
Please find page 100 of the 2014 Samsung annual report below. You can navigate through the pages in the report by either clicking on the pages listed below, or by using the keyword search tool below to find specific information within the annual report.-
 1
1 -
2
-
3
-
4
-
5
-
6
-
7
-
8
-
9
-
10
-
11
-
12
-
13
-
14
-
15
-
16
-
17
-
18
-
19
-
20
-
21
-
22
-
23
-
24
-
25
-
26
-
27
-
28
-
29
-
30
-
31
-
32
-
33
-
34
-
35
-
36
-
37
-
38
-
39
-
40
-
41
-
42
-
43
-
44
-
45
-
46
-
47
-
48
-
49
-
50
-
51
-
52
-
53
-
54
-
55
-
56
-
57
-
58
-
59
-
60
-
61
-
62
-
63
-
64
-
65
-
66
-
67
-
68
-
69
-
70
-
71
-
72
-
73
-
74
-
75
-
76
-
77
-
78
-
79
-
80
-
81
-
82
-
83
-
84
-
85
-
86
-
87
-
88
-
89
-
 90
90 -
 91
91 -
 92
92 -
 93
93 -
 94
94 -
 95
95 -
 96
96 -
 97
97 -
 98
98 -
 99
99 -
 100
100 -
 101
101 -
 102
102 -
 103
103 -
 104
104 -
 105
105 -
 106
106 -
 107
107 -
 108
108 -
 109
109 -
 110
110 -
111
-
112
-
113
-
114
 |
 |
Financial Statements
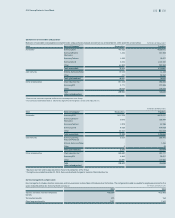
(3) Valuation technique and the inputs
The Group utilizes a present value technique to discount future cash flows at a proper interest rate for corporate bonds, government and public bonds, and bank debentures that
are classified as Level 2 in the fair value hierarchy.
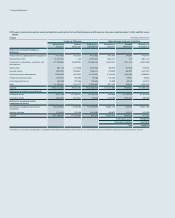
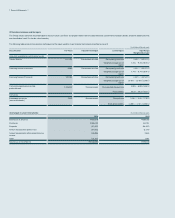
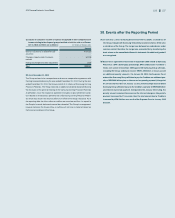
The following table presents the valuation technique and the inputs used for major financial instruments classified as Level 3.
(In mil
lions of Korean won)
Classification Fair Value Valuation Technique Level 3 Inputs Input Range
(Weighted Average)
Long-term available-for-sale financial assets
Taewon Electric ₩17,094 Discounted cash flow Permanent growth rate -1.00% ~ 1.00%(0%)
Weighted average cost of
capital
7.76% ~ 9.76%(8.76%)
Samsung Venture Investment 6,586 Discounted cash flow Permanent growth rate -1.00% ~ 1.00%(0%)
Weighted average cost of
capital
7.74% ~ 9.74%(8.74%)
Samsung General Chemicals 100,051 Discounted cash flow Permanent growth rate -1.00% ~ 1.00%(0%)
Weighted average cost of
capital
10.48% ~ 12.48%(11.48%)
Corning Incorporated convertible
preferred stock 3,106,332 Trinomial model Risk adjusted discount rate 4.96% ~ 6.96%(5.96%)
Price volatility 30.5% ~ 36.5%(33.5%)
Derivatives
Embedded derivatives
(convertible bonds)
2,462 Binomial model Discount rate 5.16% ~ 10.3% (7.78%)
Stock price volatility 11.88% ~ 17.6% (14.53%)
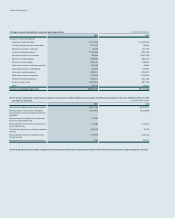
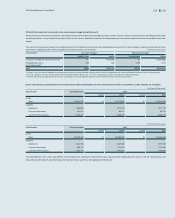
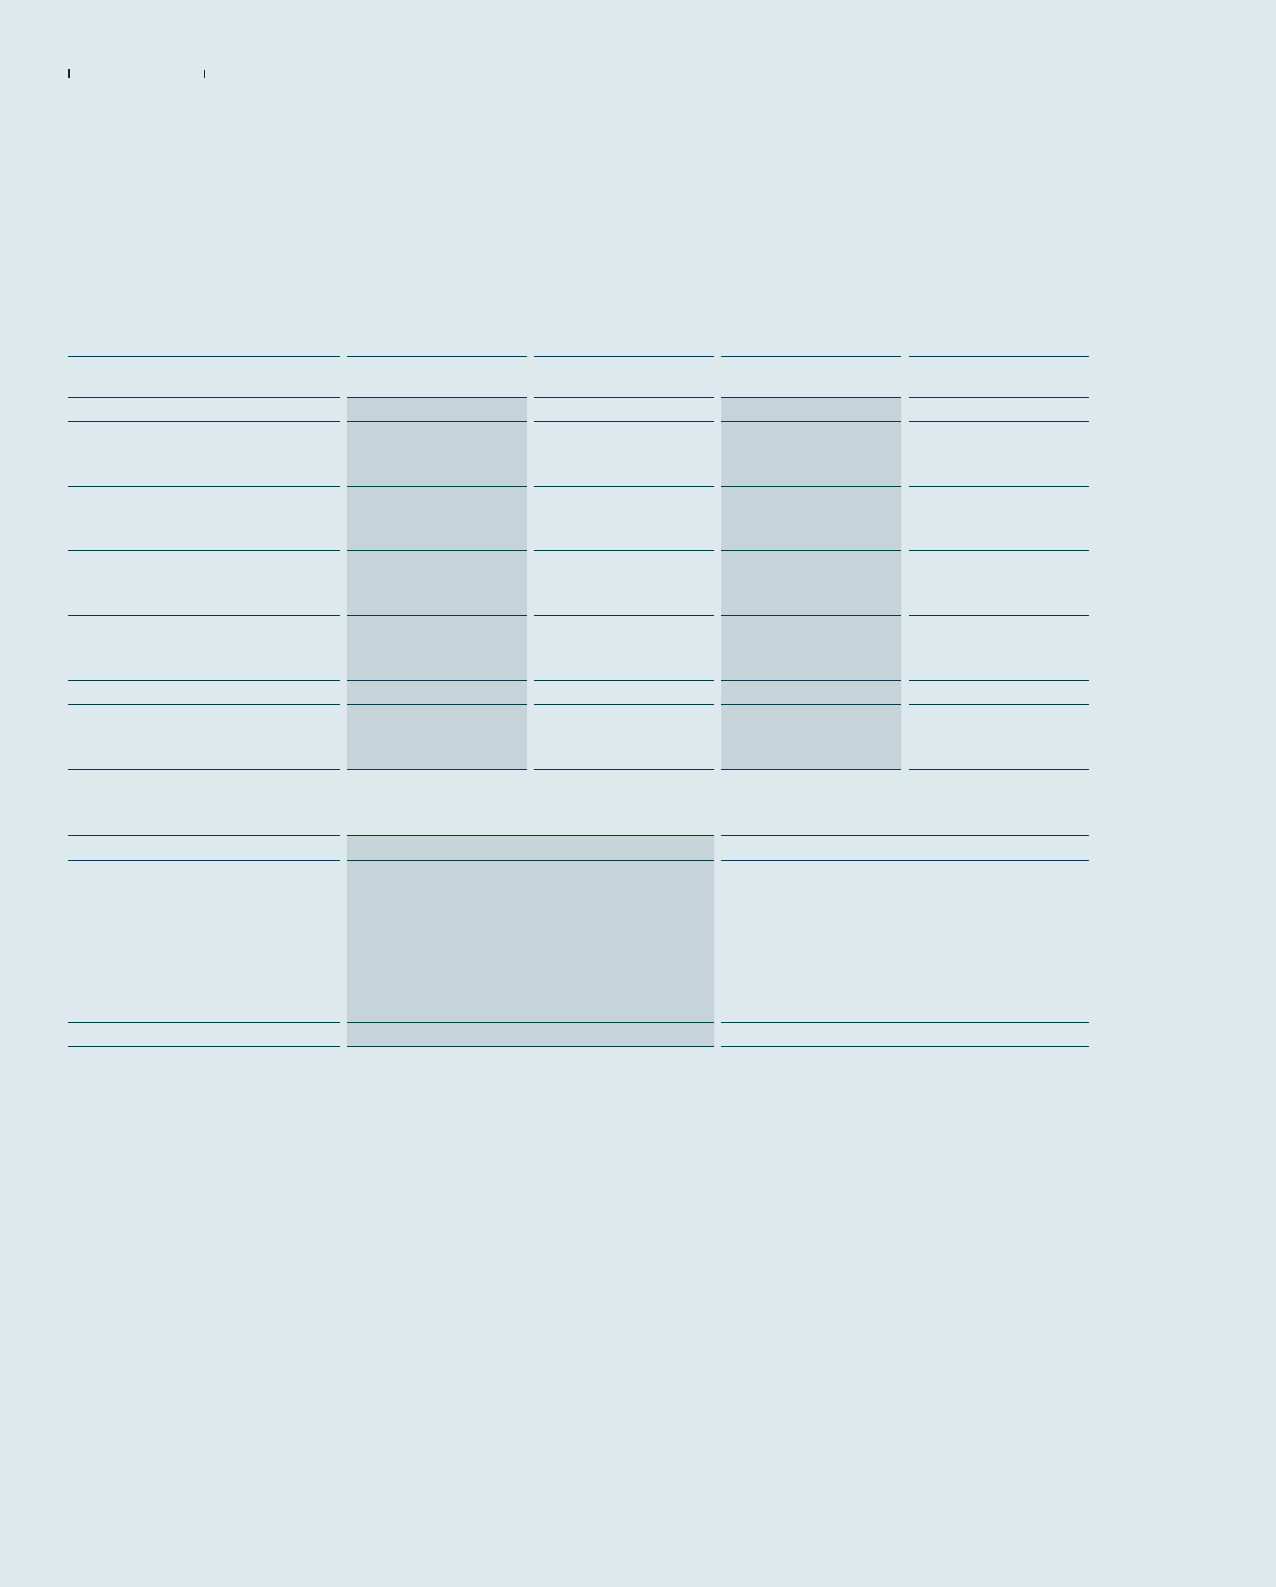
(4) Changes in Level 3 instruments: (In millions of Korean won)
2014 2013
Balance as at January 1 ₩493,378 ₩389,195
Purchases 2,586,120 151,741
Disposals (97,487) (46,357)
Amount recognized in profit or loss (67,581) (5,177)
Amount recognized in other comprehensive
income
646,856 2,615
Other (13,191)1,361
Balance as at December 31 ₩3,548,095 ₩493,378