Samsung 2014 Annual Report Download - page 90
Download and view the complete annual report
Please find page 90 of the 2014 Samsung annual report below. You can navigate through the pages in the report by either clicking on the pages listed below, or by using the keyword search tool below to find specific information within the annual report.-
 1
1 -
2
-
3
-
4
-
5
-
6
-
7
-
8
-
9
-
10
-
11
-
12
-
13
-
14
-
15
-
16
-
17
-
18
-
19
-
20
-
21
-
22
-
23
-
24
-
25
-
26
-
27
-
28
-
29
-
30
-
31
-
32
-
33
-
34
-
35
-
36
-
37
-
38
-
39
-
40
-
41
-
42
-
43
-
44
-
45
-
46
-
47
-
48
-
49
-
50
-
51
-
52
-
53
-
54
-
55
-
56
-
57
-
58
-
59
-
60
-
61
-
62
-
63
-
64
-
65
-
66
-
67
-
68
-
69
-
70
-
71
-
72
-
73
-
74
-
75
-
76
-
77
-
78
-
79
-
 80
80 -
 81
81 -
 82
82 -
 83
83 -
 84
84 -
 85
85 -
 86
86 -
 87
87 -
 88
88 -
 89
89 -
 90
90 -
 91
91 -
 92
92 -
 93
93 -
 94
94 -
 95
95 -
 96
96 -
 97
97 -
 98
98 -
 99
99 -
 100
100 -
101
-
102
-
103
-
104
-
105
-
106
-
107
-
108
-
109
-
110
-
111
-
112
-
113
-
114
 |
 |

Financial Statements
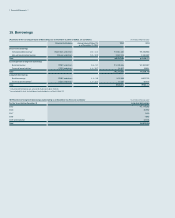
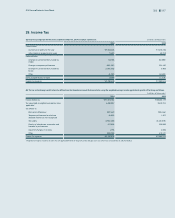
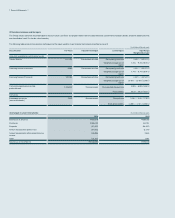
(C) Changes in deferred income tax assets and liabilities resulting from the tax effect of temporary differences for the years ended December 31, 2014 and 2013, are as
follows:
(1) 2014 (In millions of Korean won)
Temporary Differences Deferred Income Tax Assets (Liabilities)
Balance as at
January 1
Increase
(Decrease)
Balance as at
December 31
Balance as at
January 1
Increase
(Decrease)
Balance as at
December 31
Deferred tax arising from temporary
differences
Special reserves appropriated for tax purposes ₩(27,785)₩13,417 ₩(14,368)₩(6,724)₩3,247 ₩(3,477)
Revaluation of land (3,476,104)412 (3,475,692) (841,217)100 (841,117)
Investments in subsidiaries, associates and
joint ventures1
(27,819,662) (3,649,494) (31,469,156) (4,000,627) (241,471) (4,242,098)
Depreciation 834,746 1,774,306 2,609,052 135,376 507,818 643,194
Accrued income (303,790) (231,881) (535,671) (72,845) (59,392) (132,237)
Provisions and accrued expenses 12,345,693 (912,792)11,432,901 3,153,146 (194,336)2,958,810
Foreign currency translation (181,302)280,090 98,788 (44,025)69,541 25,516
Asset impairment losses 342,089 237,566 579,655 81,899 59,478 141,377
Other (4,185,045)1,951,177 (2,233,868) (877,479)338,305 (539,174)
Subtotal ₩(22,471,160)₩(537,199)₩(23,008,359)₩(2,472,496)₩483,290 ₩(1,989,206)
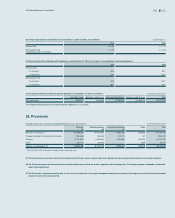
Deferred tax arising from carryforwards
Unused tax losses ₩107,228 ₩7,358,111 ₩7,465,339 ₩25,006 ₩1,792,553 ₩1,817,559
Unused tax credits 1,341,650 (602,202)739,448 1,312,192 (722,023)590,169
Deferred tax recognized in other
comprehensive income
Valuation of available-for-sale financial
instruments
₩(2,887,880)₩338,495 ₩(2,549,385)₩(664,172)₩53,434 ₩(610,738)
Actuarial valuation 1,718,454 922,439 2,640,893 408,879 212,121 621,000
Subtotal ₩(1,169,426)₩1,260,934 ₩91,508 ₩(255,293)₩265,555 ₩10,262
Deferred tax assets ₩4,526,595
Deferred tax liabilities (4,097,811)
Total ₩428,784
1 Deferred tax assets were not recognized if it is probable that the temporary differences will not reverse in the foreseeable future for investments in subsidiaries, associates and joint ventures.