Samsung 2014 Annual Report Download - page 3
Download and view the complete annual report
Please find page 3 of the 2014 Samsung annual report below. You can navigate through the pages in the report by either clicking on the pages listed below, or by using the keyword search tool below to find specific information within the annual report.-
 1
1 -
 2
2 -
 3
3 -
 4
4 -
 5
5 -
 6
6 -
 7
7 -
 8
8 -
 9
9 -
 10
10 -
 11
11 -
 12
12 -
 13
13 -
 14
14 -
15
-
16
-
17
-
18
-
19
-
20
-
21
-
22
-
23
-
24
-
25
-
26
-
27
-
28
-
29
-
30
-
31
-
32
-
33
-
34
-
35
-
36
-
37
-
38
-
39
-
40
-
41
-
42
-
43
-
44
-
45
-
46
-
47
-
48
-
49
-
50
-
51
-
52
-
53
-
54
-
55
-
56
-
57
-
58
-
59
-
60
-
61
-
62
-
63
-
64
-
65
-
66
-
67
-
68
-
69
-
70
-
71
-
72
-
73
-
74
-
75
-
76
-
77
-
78
-
79
-
80
-
81
-
82
-
83
-
84
-
85
-
86
-
87
-
88
-
89
-
90
-
91
-
92
-
93
-
94
-
95
-
96
-
97
-
98
-
99
-
100
-
101
-
102
-
103
-
104
-
105
-
106
-
107
-
108
-
109
-
110
-
111
-
112
-
113
-
114
 |
 |
This annual report includes forward-looking statements that relate to future events and
can be generally identified by phrases containing words such as “believes,” “expects,”
“anticipates,” “foresees,” “forecasts,” “estimates” or other words or phrases of similar
meaning. These forward-looking statements are not guarantees of future performance
and may involve known and unknown risks, uncertainties and other factors that may
affect our actual results, performance, achievements or financial position, making them
materially different from the actual future results, performance, achievements or financial
position expressed or implied by these forward-looking statements. Unless otherwise
specified, all data presented in this report is from our consolidated financial statements.
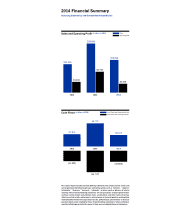
2014 Financial Summary
Samsung Electronics and Consolidated Subsidiaries
Cash Flows from Operating Activities
Cash Flows from Investing Activities
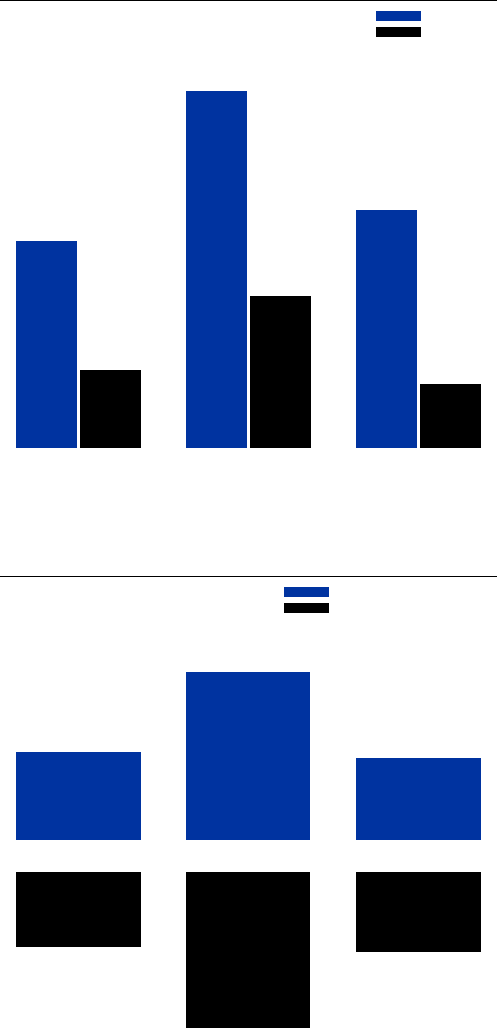
Sales
Operating Profit
Sales and Operating Profit (in billions of KRW)
Cash Flows (in billions of KRW)
201,104
29,049
36,785
2012 2013 2014
206,206
25,025
228,693
(44,747)
37,973
46,707
36,975
(31,322) (32,806)
2012 2013 2014