Samsung 2014 Annual Report Download - page 65
Download and view the complete annual report
Please find page 65 of the 2014 Samsung annual report below. You can navigate through the pages in the report by either clicking on the pages listed below, or by using the keyword search tool below to find specific information within the annual report.-
 1
1 -
2
-
3
-
4
-
5
-
6
-
7
-
8
-
9
-
10
-
11
-
12
-
13
-
14
-
15
-
16
-
17
-
18
-
19
-
20
-
21
-
22
-
23
-
24
-
25
-
26
-
27
-
28
-
29
-
30
-
31
-
32
-
33
-
34
-
35
-
36
-
37
-
38
-
39
-
40
-
41
-
42
-
43
-
44
-
45
-
46
-
47
-
48
-
49
-
50
-
51
-
52
-
53
-
54
-
 55
55 -
 56
56 -
 57
57 -
 58
58 -
 59
59 -
 60
60 -
 61
61 -
 62
62 -
 63
63 -
 64
64 -
 65
65 -
 66
66 -
 67
67 -
 68
68 -
 69
69 -
 70
70 -
 71
71 -
 72
72 -
 73
73 -
 74
74 -
 75
75 -
76
-
77
-
78
-
79
-
80
-
81
-
82
-
83
-
84
-
85
-
86
-
87
-
88
-
89
-
90
-
91
-
92
-
93
-
94
-
95
-
96
-
97
-
98
-
99
-
100
-
101
-
102
-
103
-
104
-
105
-
106
-
107
-
108
-
109
-
110
-
111
-
112
-
113
-
114
 |
 |
063062
2014 Samsung Electronics Annual Report2014 Samsung Electronics Annual Report
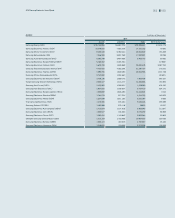
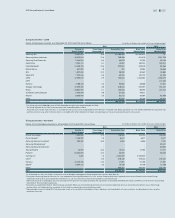
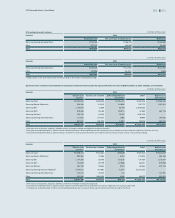
6. Financial Instruments by Category
(A) Categorizations of financial assets and liabilities as at December 31, 2014 and 2013, are as follows:
(1) As at December 31, 2014 (In millions of Korean won)
Assets Assets at fair value through
profit or loss
Loans and
receivables
Available-for-sale
financial assets
Total
Cash and cash equivalents ₩- ₩16,840,766 ₩- ₩16,840,766
Short-term financial instruments - 41,689,776 - 41,689,776
Short-term available-for-sale financial assets - - 3,286,798 3,286,798
Trade receivables - 24,694,610 - 24,694,610
Long-term available-for-sale financial assets - - 12,667,509 12,667,509
Other 48,360 4,614,560 100,051 4,762,971
Total ₩48,360 ₩87,839,712 ₩16,054,358 ₩103,942,430
(In millions of Korean won)
Liabilities Liabilities at fair value
through profit or loss
Financial liabilities
measured at amortized cost
Other
financial liabilities
Total
Trade payables ₩- ₩7,914,704 ₩- ₩7,914,704
Short-term borrowings - 3,367,915 4,661,384 8,029,299
Other payables - 9,258,344 - 9,258,344
Current portion of long-term liabilities - 1,778,667 - 1,778,667
Debentures - 1,355,882 - 1,355,882
Long-term borrowings - 101,671 - 101,671
Long-term other payables - 2,520,277 - 2,520,277
Other 78,348 11,395,781 - 11,474,129
Total ₩78,348 ₩37,693,241 ₩4,661,384 ₩42,432,973
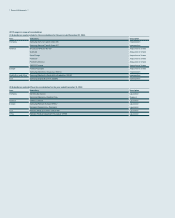
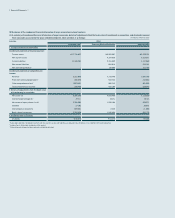
(2) As at December 31, 2013 (In millions of Korean won)
Assets Assets at fair value through
profit or loss
Loans and
receivables
Available-for-sale
financial assets
Total
Cash and cash equivalents ₩- ₩16,284,780 ₩- ₩16,284,780
Short-term financial instruments - 36,722,702 - 36,722,702
Short-term available-for-sale financial assets - - 1,488,527 1,488,527
Trade receivables - 24,988,532 - 24,988,532
Long-term available-for-sale financial assets - - 6,238,380 6,238,380
Other 40,552 5,432,404 - 5,472,956
Total ₩40,552 ₩83,428,418 ₩7,726,907 ₩91,195,877
(In millions of Korean won)
Liabilities Liabilities at fair value
through profit or loss
Financial liabilities
measured at amortized cost
Other
financial liabilities
Total
Trade payables ₩- ₩8,437,139 ₩- ₩8,437,139
Short-term borrowings - 3,181,582 3,256,935 6,438,517
Other payables - 7,877,581 - 7,877,581
Current portion of long-term liabilities - 2,425,831 - 2,425,831
Debentures - 1,311,068 - 1,311,068
Long-term borrowings - 985,117 - 985,117
Long-term other payables - 1,023,714 - 1,023,714
Other 244,172 10,618,340 - 10,862,512
Total ₩244,172 ₩35,860,372 ₩3,256,935 ₩39,361,479