Samsung 2014 Annual Report Download - page 88
Download and view the complete annual report
Please find page 88 of the 2014 Samsung annual report below. You can navigate through the pages in the report by either clicking on the pages listed below, or by using the keyword search tool below to find specific information within the annual report.-
 1
1 -
2
-
3
-
4
-
5
-
6
-
7
-
8
-
9
-
10
-
11
-
12
-
13
-
14
-
15
-
16
-
17
-
18
-
19
-
20
-
21
-
22
-
23
-
24
-
25
-
26
-
27
-
28
-
29
-
30
-
31
-
32
-
33
-
34
-
35
-
36
-
37
-
38
-
39
-
40
-
41
-
42
-
43
-
44
-
45
-
46
-
47
-
48
-
49
-
50
-
51
-
52
-
53
-
54
-
55
-
56
-
57
-
58
-
59
-
60
-
61
-
62
-
63
-
64
-
65
-
66
-
67
-
68
-
69
-
70
-
71
-
72
-
73
-
74
-
75
-
76
-
77
-
 78
78 -
 79
79 -
 80
80 -
 81
81 -
 82
82 -
 83
83 -
 84
84 -
 85
85 -
 86
86 -
 87
87 -
 88
88 -
 89
89 -
 90
90 -
 91
91 -
 92
92 -
 93
93 -
 94
94 -
 95
95 -
 96
96 -
 97
97 -
 98
98 -
99
-
100
-
101
-
102
-
103
-
104
-
105
-
106
-
107
-
108
-
109
-
110
-
111
-
112
-
113
-
114
 |
 |

Financial Statements
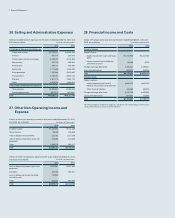
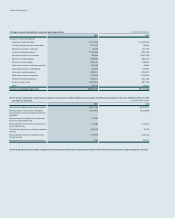
26. Selling and Administrative Expenses
Selling and administrative expenses for the years ended December 31, 2014 and
2013, are as follows: (In millions of Korean won)
2014 2013
1) Selling and Administrative Expenses
Wages and salaries ₩5,214,171 ₩5,559,339
Pension 300,776 232,676
Commissions and service charges 8,499,107 9,124,803
Depreciation 670,709 555,944
Amortization 399,717 401,987
Advertising 3,773,649 4,165,290
Sales promotion 7,760,648 8,019,462
Transportation 3,733,045 3,929,114
Warranty 3,201,776 2,967,724
Other 4,963,012 4,935,604
2) Research and development expenses
Total expenses 15,325,507 14,780,432
Capitalized expenses (940,001) (461,030)
Total ₩52,902,116 ₩54,211,345
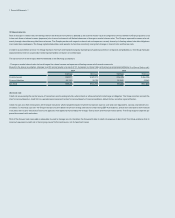
27. Other Non-Operating Income and
Expense
Details of other non-operating income for the years ended December 31, 2014
and 2013, are as follows: (In millions of Korean won)
2014 2013
Dividend income ₩1,436,235 ₩112,159
Rental income 89,199 104,608
Gain on disposal of investments 152,281 1,117,029
Gain on disposal of property, plant and
equipment
228,366 110,638
Other 1,895,276 985,117
Total ₩3,801,357 ₩2,429,551
Details of other non-operating expense for the years ended December 31, 2014
and 2013, are as follows: (In millions of Korean won)
2014 2013
Loss on disposal of property, plant and
equipment
₩222,841 ₩187,863
Donations 409,796 495,301
Loss on disposal of assets classified
as held-for-sale
723,869 -
Other 903,231 930,884
Total ₩2,259,737 ₩1,614,048
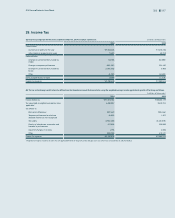
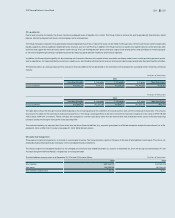
28. Financial Income and Costs
Details of financial income and costs for the years ended December 31, 2014 and
2013, are as follows: (In millions of Korean won)
2014 2013
Financial income
Interest income
Interest income from loans and receiv-
ables
₩1,734,963 ₩1,342,394
Interest income from available-for-
sale financial assets 98,398 9,215
Foreign exchange differences 5,766,640 6,199,517
Gains from derivatives 659,828 463,546
Total ₩8,259,829 ₩8,014,672
Financial costs
Interest expense:
Interest expense from financial
liabilities measured at amortized cost
₩466,371 ₩319,342
Other financial liabilities 126,569 190,316
Foreign exchange differences 6,016,728 6,529,622
Losses from derivatives 684,334 715,692
Total ₩7,294,002 ₩7,754,972
The Group recognizes foreign exchange gains and losses arising from foreign currency trans-
actions and translation as financial income and costs.