Samsung 2014 Annual Report Download - page 42
Download and view the complete annual report
Please find page 42 of the 2014 Samsung annual report below. You can navigate through the pages in the report by either clicking on the pages listed below, or by using the keyword search tool below to find specific information within the annual report.-
 1
1 -
2
-
3
-
4
-
5
-
6
-
7
-
8
-
9
-
10
-
11
-
12
-
13
-
14
-
15
-
16
-
17
-
18
-
19
-
20
-
21
-
22
-
23
-
24
-
25
-
26
-
27
-
28
-
29
-
30
-
31
-
 32
32 -
 33
33 -
 34
34 -
 35
35 -
 36
36 -
 37
37 -
 38
38 -
 39
39 -
 40
40 -
 41
41 -
 42
42 -
 43
43 -
 44
44 -
 45
45 -
 46
46 -
 47
47 -
 48
48 -
 49
49 -
 50
50 -
 51
51 -
 52
52 -
53
-
54
-
55
-
56
-
57
-
58
-
59
-
60
-
61
-
62
-
63
-
64
-
65
-
66
-
67
-
68
-
69
-
70
-
71
-
72
-
73
-
74
-
75
-
76
-
77
-
78
-
79
-
80
-
81
-
82
-
83
-
84
-
85
-
86
-
87
-
88
-
89
-
90
-
91
-
92
-
93
-
94
-
95
-
96
-
97
-
98
-
99
-
100
-
101
-
102
-
103
-
104
-
105
-
106
-
107
-
108
-
109
-
110
-
111
-
112
-
113
-
114
 |
 |

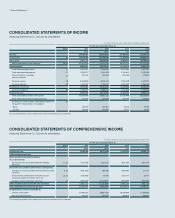
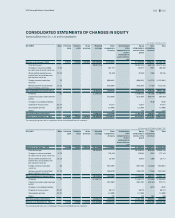
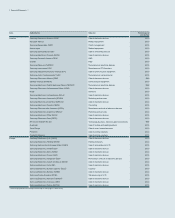
Financial Statements
CONSOLIDATED STATEMENTS OF FINANCIAL POSITION
Samsung Electronics Co., Ltd. and its subsidiaries
(In millions of Korean won, in thousands of US dollars (Note 2.28))
Notes December 31, 2014 December 31, 2013 December 31, 2014 December 31, 2013
KRW KRW USD USD
Assets
Current assets
Cash and cash equivalents 4, 6, 7 16,840,766 16,284,780 15,997,688 15,469,535
Short-term financial instruments 5, 6, 7 41,689,776 36,722,702 39,602,713 34,884,299
Short-term available-for-sale financial assets 6, 9 3,286,798 1,488,527 3,122,255 1,414,009
Trade receivables 6, 7, 10 24,694,610 24,988,532 23,458,355 23,737,562
Non-trade receivables 10 3,539,875 2,887,402 3,362,663 2,742,854
Advances 1,989,470 1,928,188 1,889,874 1,831,660
Prepaid expenses 3,346,593 2,472,950 3,179,057 2,349,150
Inventories 11 17,317,504 19,134,868 16,450,560 18,176,943
Other current assets 1,795,143 2,135,589 1,705,275 2,028,678
Assets held-for-sale 12, 37 645,491 2,716,733 613,177 2,580,729
Total current assets 115,146,026 110,760,271 109,381,617 105,215,419
Non-current assets
Long-term available-for-sale financial assets 6, 9 12,667,509 6,238,380 12,033,351 5,926,076
Investment in associates and joint ventures 12 5,232,461 6,422,292 4,970,515 6,100,781
Property, plant and equipment 13 80,872,950 75,496,388 76,824,309 71,716,907
Intangible assets 14 4,785,473 3,980,600 4,545,904 3,781,324
Long-term prepaid expenses 4,857,126 3,465,783 4,613,970 3,292,280
Deferred income tax assets 29 4,526,595 4,621,780 4,299,986 4,390,406
Other non-current assets 2,334,818 3,089,524 2,217,933 2,934,857
Total assets 230,422,958 214,075,018 218,887,585 203,358,050
The accompanying notes are an integral part of these consolidated financial statements.