Samsung 2014 Annual Report Download - page 89
Download and view the complete annual report
Please find page 89 of the 2014 Samsung annual report below. You can navigate through the pages in the report by either clicking on the pages listed below, or by using the keyword search tool below to find specific information within the annual report.-
 1
1 -
2
-
3
-
4
-
5
-
6
-
7
-
8
-
9
-
10
-
11
-
12
-
13
-
14
-
15
-
16
-
17
-
18
-
19
-
20
-
21
-
22
-
23
-
24
-
25
-
26
-
27
-
28
-
29
-
30
-
31
-
32
-
33
-
34
-
35
-
36
-
37
-
38
-
39
-
40
-
41
-
42
-
43
-
44
-
45
-
46
-
47
-
48
-
49
-
50
-
51
-
52
-
53
-
54
-
55
-
56
-
57
-
58
-
59
-
60
-
61
-
62
-
63
-
64
-
65
-
66
-
67
-
68
-
69
-
70
-
71
-
72
-
73
-
74
-
75
-
76
-
77
-
78
-
 79
79 -
 80
80 -
 81
81 -
 82
82 -
 83
83 -
 84
84 -
 85
85 -
 86
86 -
 87
87 -
 88
88 -
 89
89 -
 90
90 -
 91
91 -
 92
92 -
 93
93 -
 94
94 -
 95
95 -
 96
96 -
 97
97 -
 98
98 -
 99
99 -
100
-
101
-
102
-
103
-
104
-
105
-
106
-
107
-
108
-
109
-
110
-
111
-
112
-
113
-
114
 |
 |

087086
2014 Samsung Electronics Annual Report2014 Samsung Electronics Annual Report
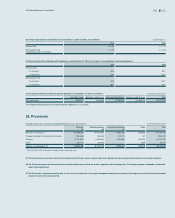
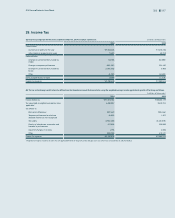
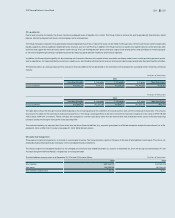
29. Income Tax
(A) Income tax expense for the years ended December 31, 2014 and 2013, consists of: (In millions of Korean won)
2014 2013
Current taxes:
Current tax on profits for the year ₩5,953,438 ₩7,406,736
Adjustments in respect to prior years 71,530 52,318
Deferred taxes:
Changes in carryforward of unused tax
credits
722,023 (52,085)
Changes in temporary differences (483,290)501,450
Changes in carryforward of unused tax
losses
(1,792,553)2,805
Other (3,430) (10,490)
Items charged directly to equity 12,958 (11,219)
Income tax expense ₩4,480,676 ₩7,889,515
(B) The tax on the Group’s profit before tax differs from the theoretical amount that would arise using the weighted average tax rate applicable to profits of the Group as follows:
(In millions of Korean won)
2014 2013
Income before tax ₩27,875,034 ₩38,364,279
Tax calculated at weighted average tax rates
applicable1
6,880,857 9,576,241
Tax effects of:
Permanent differences (292,554) (335,146)
Temporary differences for which no
deferred income tax was recognized
(9,631)1,307
Tax credits (1,942,488) (2,156,519)
Results of subsidiaries, associates and
interests in joint ventures
201,835 318,359
Impact of changes in tax rates 1,756 5,526
Other (359,099)479,747
Income tax expense ₩4,480,676 ₩7,889,515
1 Weighted average of statutory tax rates that are applied differently for the profits of the Group at each tax authority as at December 31, 2014 and 2013.