Samsung 2014 Annual Report Download - page 79
Download and view the complete annual report
Please find page 79 of the 2014 Samsung annual report below. You can navigate through the pages in the report by either clicking on the pages listed below, or by using the keyword search tool below to find specific information within the annual report.-
 1
1 -
2
-
3
-
4
-
5
-
6
-
7
-
8
-
9
-
10
-
11
-
12
-
13
-
14
-
15
-
16
-
17
-
18
-
19
-
20
-
21
-
22
-
23
-
24
-
25
-
26
-
27
-
28
-
29
-
30
-
31
-
32
-
33
-
34
-
35
-
36
-
37
-
38
-
39
-
40
-
41
-
42
-
43
-
44
-
45
-
46
-
47
-
48
-
49
-
50
-
51
-
52
-
53
-
54
-
55
-
56
-
57
-
58
-
59
-
60
-
61
-
62
-
63
-
64
-
65
-
66
-
67
-
68
-
 69
69 -
 70
70 -
 71
71 -
 72
72 -
 73
73 -
 74
74 -
 75
75 -
 76
76 -
 77
77 -
 78
78 -
 79
79 -
 80
80 -
 81
81 -
 82
82 -
 83
83 -
 84
84 -
 85
85 -
 86
86 -
 87
87 -
 88
88 -
 89
89 -
90
-
91
-
92
-
93
-
94
-
95
-
96
-
97
-
98
-
99
-
100
-
101
-
102
-
103
-
104
-
105
-
106
-
107
-
108
-
109
-
110
-
111
-
112
-
113
-
114
 |
 |

077076
2014 Samsung Electronics Annual Report2014 Samsung Electronics Annual Report
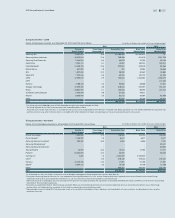
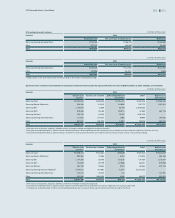
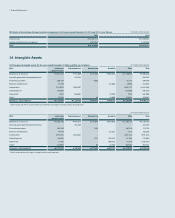
(B) Goodwill
Goodwill is allocated to cash-generating units at the end of the reporting period, and consists of the following: (In millions of Korean won)
2014 2013
CE ₩379,612 ₩199,758
IM 15,028 14,428
Semiconductor 181,126 183,539
DP 80,299 80,299
Other 83,511 82,510
Total ₩739,576 ₩560,534
Goodwill impairment reviews are undertaken annually, and the recoverable amounts of cash-generating units have been determined based on value-in-use calculations. These
calculations use pre-tax cash flow projections based on financial budgets approved by management covering a five-year period. Cash flows beyond the five-year period are
extrapolated using the estimated growth rates stated below. The growth rate does not exceed the long-term average growth rate for the business. In addition, a constant growth
rate assumption is used for perpetual cash flow calculation.
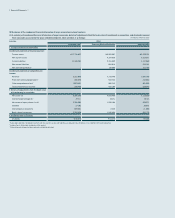
(1) For the year ended December 31, 2014, pursuant to the results of the goodwill impairment reviews performed, the Group recognized an impairment of KRW 7,838 mil-
lion on goodwill recognized at Samsung France Research Center (SFRC). The key assumptions used in calculating the value in use were as follows:
(In percentage, %)
Key assumptions
Sales growth rate -
Perpetual growth rate -
Pre-tax discount rate123.7
1 Pre-tax discount rate applied to the cash flow projections.
(2) For the year ended December 31, 2013, pursuant to the results of the goodwill impairment reviews performed, the Group recognized an impairment of KRW 82,599 mil-
lion on goodwill recognized in the Digital Imaging business. The key assumptions used in calculating the value-in-use were as follows: (In percentage, %)
Key assumptions
Sales growth rate10.2
Perpetual growth rate2(4.1)
Pre-tax discount rate313.0
1 Future cash flows for 5 years are projected based on previous growth rate and the industry estimates.
2 The projected growth rate beyond five years is consistent with industry estimates.
3 Pre-tax discount rate applied to the cash flow projections.
Sales growth rate was determined on the basis of past performance and expectations of market fluctuations. The discount rate reflects the special risk related to the division.
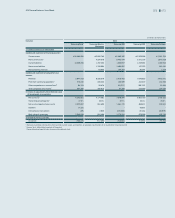
(C) Details of amortization of intangible assets by line item for the years ended December 31, 2014 and 2013, are as follows: (In millions of Korean won)
2014 2013
Cost of sales ₩554,236 ₩418,447
Selling and administrative expenses 589,159 556,954
Total ₩1,143,395 ₩975,401