Samsung 2014 Annual Report Download - page 44
Download and view the complete annual report
Please find page 44 of the 2014 Samsung annual report below. You can navigate through the pages in the report by either clicking on the pages listed below, or by using the keyword search tool below to find specific information within the annual report.-
 1
1 -
2
-
3
-
4
-
5
-
6
-
7
-
8
-
9
-
10
-
11
-
12
-
13
-
14
-
15
-
16
-
17
-
18
-
19
-
20
-
21
-
22
-
23
-
24
-
25
-
26
-
27
-
28
-
29
-
30
-
31
-
32
-
33
-
 34
34 -
 35
35 -
 36
36 -
 37
37 -
 38
38 -
 39
39 -
 40
40 -
 41
41 -
 42
42 -
 43
43 -
 44
44 -
 45
45 -
 46
46 -
 47
47 -
 48
48 -
 49
49 -
 50
50 -
 51
51 -
 52
52 -
 53
53 -
 54
54 -
55
-
56
-
57
-
58
-
59
-
60
-
61
-
62
-
63
-
64
-
65
-
66
-
67
-
68
-
69
-
70
-
71
-
72
-
73
-
74
-
75
-
76
-
77
-
78
-
79
-
80
-
81
-
82
-
83
-
84
-
85
-
86
-
87
-
88
-
89
-
90
-
91
-
92
-
93
-
94
-
95
-
96
-
97
-
98
-
99
-
100
-
101
-
102
-
103
-
104
-
105
-
106
-
107
-
108
-
109
-
110
-
111
-
112
-
113
-
114
 |
 |
Financial Statements
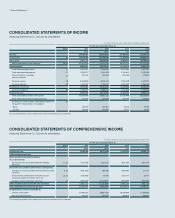
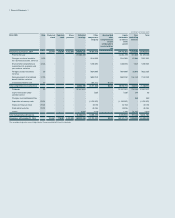
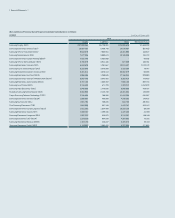
CONSOLIDATED STATEMENTS OF INCOME
Samsung Electronics Co., Ltd. and its subsidiaries
(In millions of Korean won, in thousands of US dollars (Note 2.28))
For the year ended December 31,
Notes 2014 2013 2014 2013
KRW KRW USD USD
Revenue 206,205,987 228,692,667 195,882,955 217,243,913
Cost of sales 25 128,278,800 137,696,309 121,856,939 130,802,991
Gross profit 77,927,187 90,996,358 74,026,016 86,440,922
Selling and administrative expenses 25, 26 52,902,116 54,211,345 50,253,744 51,497,430
Operating profit 25,025,071 36,785,013 23,772,272 34,943,492
Other non-operating income 27 3,801,357 2,429,551 3,611,054 2,307,923
Other non-operating expense 27 2,259,737 1,614,048 2,146,611 1,533,246
Share of profit of associates
and joint ventures
12 342,516 504,063 325,369 478,829
Financial income 28 8,259,829 8,014,672 7,846,328 7,613,444
Financial expense 28 7,294,002 7,754,972 6,928,852 7,366,745
Profit before income tax 27,875,034 38,364,279 26,479,560 36,443,697
Income tax expense 29 4,480,676 7,889,515 4,256,366 7,494,552
Profit for the year 23,394,358 30,474,764 22,223,194 28,949,145
Profit attributable to owners of the parent 23,082,499 29,821,215 21,926,949 28,328,313
Profit attributable to non-controlling interests 311,859 653,549 296,245 620,832
Earnings per share for profit attributable to owners of
the parent (in Korean Won, in US dollars)
30
- Basic 153,105 197,841 145.44 187.94
- Diluted 153,096 197,800 145.43 187.90
The accompanying notes are an integral part of these consolidated financial statements.
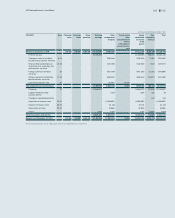
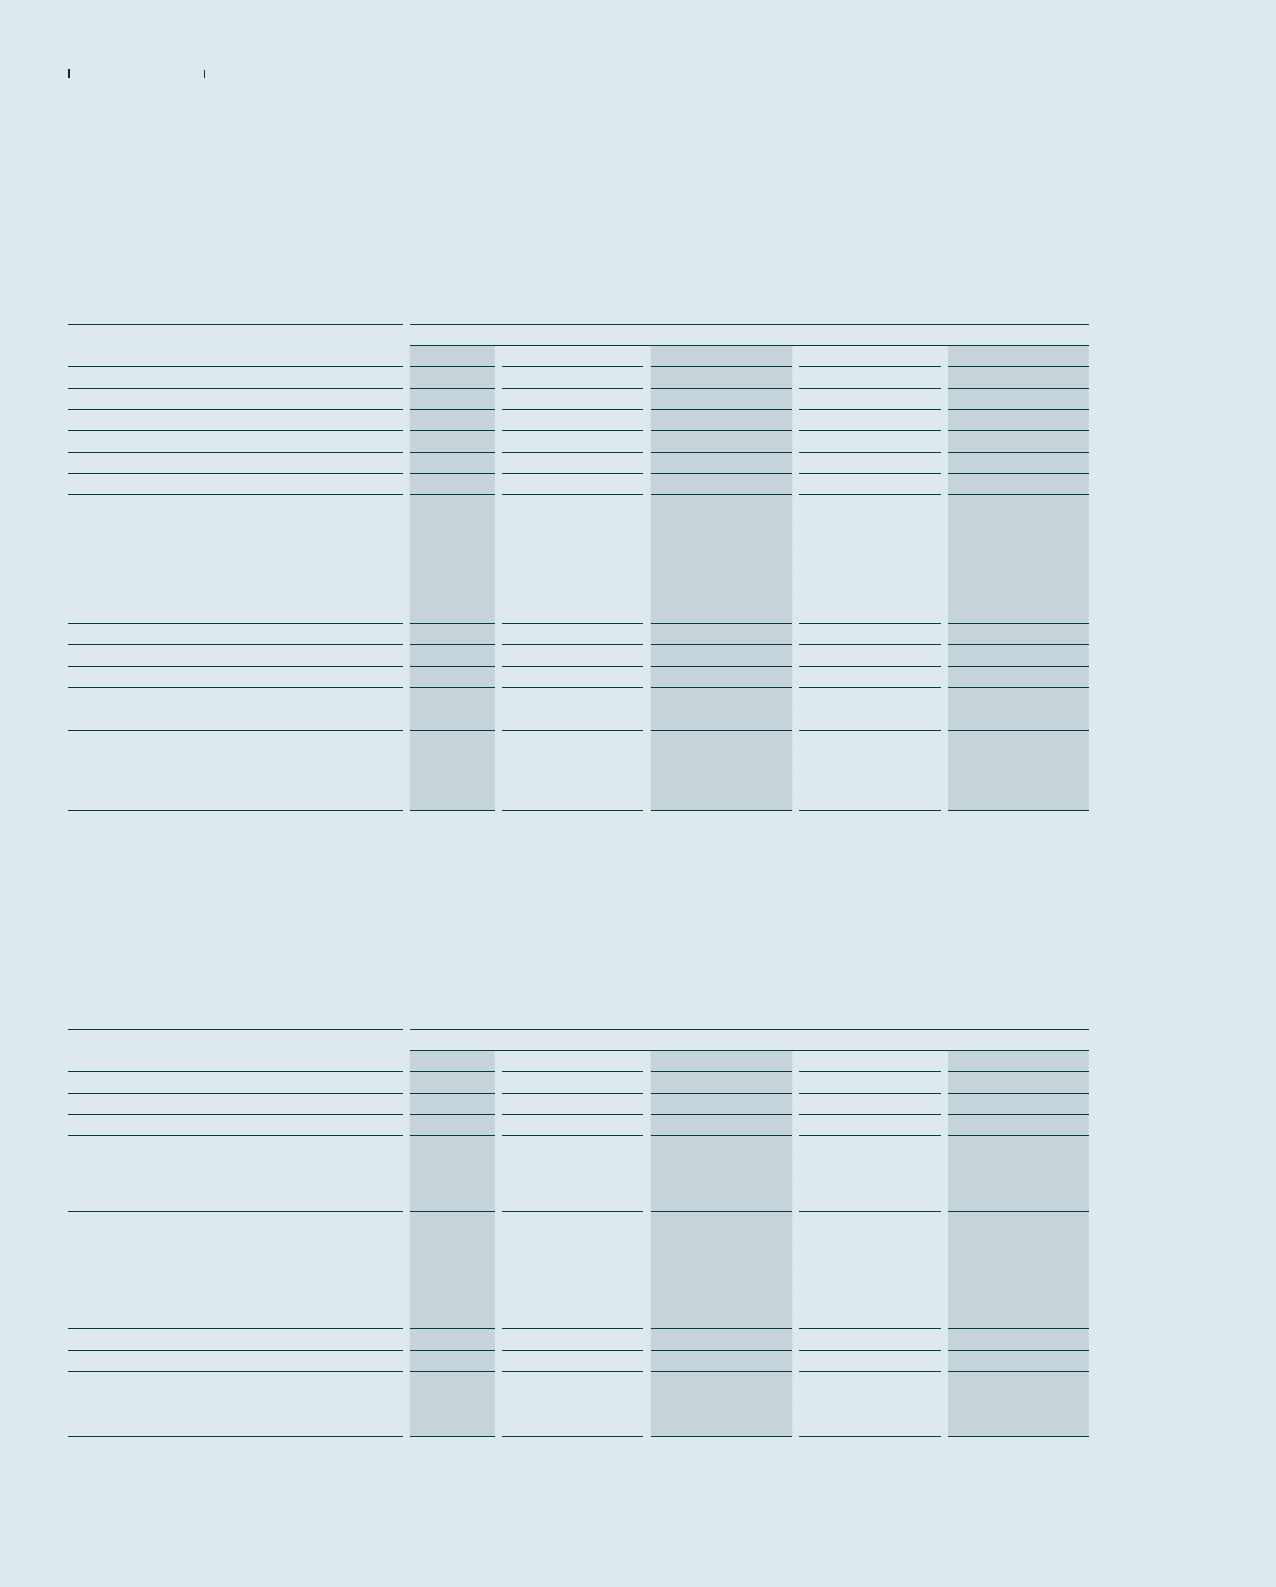
CONSOLIDATED STATEMENTS OF COMPREHENSIVE INCOME
Samsung Electronics Co., Ltd. and its subsidiaries
(In millions of Korean won, in thousands of US dollars (Note 2.28))
For the year ended December 31,
Notes 2014 2013 2014 2013
KRW KRW USD USD
Profit for the year 23,394,358 30,474,764 22,223,194 28,949,145
Other comprehensive loss
Items not to be reclassified to profit or
loss subsequently:
Remeasurement of net defined benefit liabilities,
net of tax
17, 23 (710,318) (213,113) (674,758) (202,444)
Items to be reclassified to profit or loss subsequently:
Changes in value of available-for-sale financial assets,
net of tax
9, 23 (232,105)186,480 (220,485)177,144
Share of other comprehensive income (loss) of
associates and joint ventures, net of tax
12, 23 (128,932)20,756 (122,477)19,717
Foreign currency translation, net of tax 23 (922,059) (1,000,961) (875,899) (950,851)
Other comprehensive loss for the year, net of tax (1,993,414) (1,006,838) (1,893,619) (956,434)
Total comprehensive income for the year 21,400,944 29,467,926 20,329,575 27,992,711
Comprehensive income attributable to:
Owners of the parent 20,990,732 28,837,590 19,939,900 27,393,930
Non-controlling interests 410,212 630,336 389,675 598,781
The accompanying notes are an integral part of these consolidated financial statements.