Samsung 2014 Annual Report Download - page 103
Download and view the complete annual report
Please find page 103 of the 2014 Samsung annual report below. You can navigate through the pages in the report by either clicking on the pages listed below, or by using the keyword search tool below to find specific information within the annual report.-
 1
1 -
2
-
3
-
4
-
5
-
6
-
7
-
8
-
9
-
10
-
11
-
12
-
13
-
14
-
15
-
16
-
17
-
18
-
19
-
20
-
21
-
22
-
23
-
24
-
25
-
26
-
27
-
28
-
29
-
30
-
31
-
32
-
33
-
34
-
35
-
36
-
37
-
38
-
39
-
40
-
41
-
42
-
43
-
44
-
45
-
46
-
47
-
48
-
49
-
50
-
51
-
52
-
53
-
54
-
55
-
56
-
57
-
58
-
59
-
60
-
61
-
62
-
63
-
64
-
65
-
66
-
67
-
68
-
69
-
70
-
71
-
72
-
73
-
74
-
75
-
76
-
77
-
78
-
79
-
80
-
81
-
82
-
83
-
84
-
85
-
86
-
87
-
88
-
89
-
90
-
91
-
92
-
 93
93 -
 94
94 -
 95
95 -
 96
96 -
 97
97 -
 98
98 -
 99
99 -
 100
100 -
 101
101 -
 102
102 -
 103
103 -
 104
104 -
 105
105 -
 106
106 -
 107
107 -
 108
108 -
 109
109 -
 110
110 -
 111
111 -
 112
112 -
 113
113 -
114
 |
 |

101100
2014 Samsung Electronics Annual Report2014 Samsung Electronics Annual Report
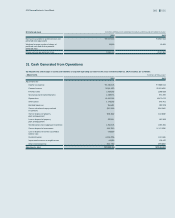
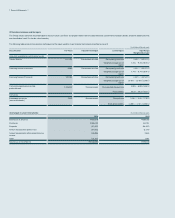
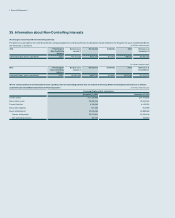
(2) For the year ended December 31, 2013 (In millions of Korean won)
2013 CE IM DS Total1Intercompany
elimination within
the group
Consolidated
Total1Semi conductor DP
Total segment
revenue
₩125,088,762 ₩299,161,654 ₩134,394,781 ₩70,908,145 ₩61,294,886 ₩558,196,178 ₩(329,503,511)₩228,692,667
Intercompany
revenue
(74,757,247) (160,344,435) (66,633,875) (33,471,566) (31,457,770) (329,503,511)329,503,511 -
Net revenue250,331,515 138,817,219 67,760,906 37,436,579 29,837,116 228,692,667 - 228,692,667
Depreciation 653,354 632,498 13,689,148 9,295,951 4,203,457 15,470,012 - 15,470,012
Amortization 93,699 188,353 416,916 294,605 106,249 975,401 - 975,401
Operating profit 1,673,343 24,957,741 10,000,665 6,887,978 2,980,563 36,785,013 - 36,785,013
1 Includes other amounts not included in specific operating segments.
2 Segment net revenue includes intersegment revenues.
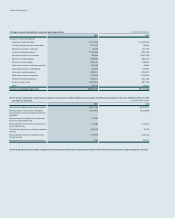
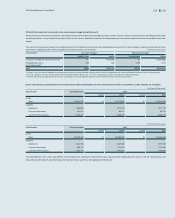
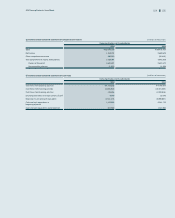
(B) Regional information
The regional segment information provided to the Management Committee for the reportable segments as at and for the years ended December 31, 2014 and 2013, is as follows:
(In millions of Korean won)
2014 Korea America Europe Asia and Africa China Intercompany
elimination
within the group
Consolidated
Net segment revenue 20,728,917 68,704,659 42,944,592 40,801,466 33,026,353 - 206,205,987
Non-current assets163,355,887 7,650,511 847,611 4,486,482 9,965,909 (647,977)85,658,423
1 Total of non-current assets other than financial instruments, deferred tax assets, and investments in associates and joint ventures.
(In millions of Korean won)
2013 Korea America Europe Asia and Africa China Intercompany
elimination
within the group
Consolidated
Net segment revenue 22,783,309 69,383,426 52,678,385 43,696,327 40,151,220 - 228,692,667
Non-current assets161,881,863 7,172,187 1,024,699 2,636,552 7,436,424 (674,737)79,476,988
1 Total of non-current assets other than financial instruments, deferred tax assets, and investments in associates and joint ventures.