Samsung 2014 Annual Report Download - page 66
Download and view the complete annual report
Please find page 66 of the 2014 Samsung annual report below. You can navigate through the pages in the report by either clicking on the pages listed below, or by using the keyword search tool below to find specific information within the annual report.-
 1
1 -
2
-
3
-
4
-
5
-
6
-
7
-
8
-
9
-
10
-
11
-
12
-
13
-
14
-
15
-
16
-
17
-
18
-
19
-
20
-
21
-
22
-
23
-
24
-
25
-
26
-
27
-
28
-
29
-
30
-
31
-
32
-
33
-
34
-
35
-
36
-
37
-
38
-
39
-
40
-
41
-
42
-
43
-
44
-
45
-
46
-
47
-
48
-
49
-
50
-
51
-
52
-
53
-
54
-
55
-
 56
56 -
 57
57 -
 58
58 -
 59
59 -
 60
60 -
 61
61 -
 62
62 -
 63
63 -
 64
64 -
 65
65 -
 66
66 -
 67
67 -
 68
68 -
 69
69 -
 70
70 -
 71
71 -
 72
72 -
 73
73 -
 74
74 -
 75
75 -
 76
76 -
77
-
78
-
79
-
80
-
81
-
82
-
83
-
84
-
85
-
86
-
87
-
88
-
89
-
90
-
91
-
92
-
93
-
94
-
95
-
96
-
97
-
98
-
99
-
100
-
101
-
102
-
103
-
104
-
105
-
106
-
107
-
108
-
109
-
110
-
111
-
112
-
113
-
114
 |
 |

Financial Statements
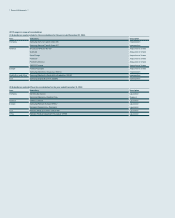
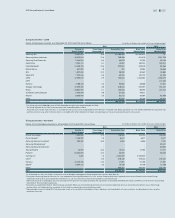
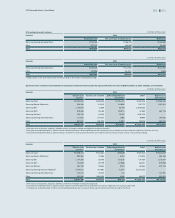
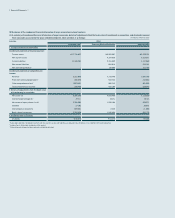
(B) Net gains or net losses on each category of financial instruments for the years ended December 31, 2014 and 2013, are as follows:
(1) As at December 31, 2014 (In millions of Korean won)
Financial Assets Assets at fair value through
profit or loss
Loans and
receivables
Available-for-sale
financial assets
Total
Loss on valuation (other comprehensive income)₩- ₩- ₩(117,455)₩(117,455)
Gain/(loss) on valuation/disposal (profit or loss) (8,755) (23,522)168,869 136,592
Reclassification from other comprehensive income to
profit or loss
- - (153,693) (153,693)
Interest income - 1,734,963 98,398 1,833,361
Foreign exchange differences (profit or loss)- (59,125)- (59,125)
Foreign exchange differences
(other comprehensive income)
- - (127,288) (127,288)
Dividend income - - 1,436,235 1,436,235
Impairment/reversal (profit or loss)- 12,387 (67,636) (55,249)
(In millions of Korean won)
Financial Liabilities Liabilities at fair value
through profit or loss
Financial liabilities mea-
sured at amortized cost
Other financial liabilities Total
Loss on valuation/disposal (profit or loss)₩(15,153)₩-₩- ₩(15,153)
Interest expense - 466,371 126,569 592,940
Foreign exchange differences (profit or loss)- (343,865) 61,644 (282,221)
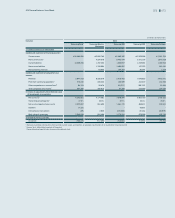
(2) As at December 31, 2013 (In millions of Korean won)
Financial Assets Assets at fair value through
profit or loss
Loans and
receivables
Available-for-sale
financial assets
Total
Gain on valuation (other comprehensive income)₩- ₩- ₩1,271,817 ₩1,271,817
Gain/(loss) on valuation/disposal (profit or loss) (32,867) (33,518)1,079,393 1,013,008
Reclassification from other comprehensive income to
profit or loss - - (1,000,260) (1,000,260)
Interest income - 1,342,394 9,215 1,351,609
Foreign exchange differences (profit or loss)- (393,407)- (393,407)
Foreign exchange differences
(other comprehensive income)
- - 939 939
Dividend income - - 112,159 112,159
Impairment/reversal (profit or loss)- (18,681) (5,177) (23,858)
(In millions of Korean won)
Financial Liabilities Liabilities at fair value
through profit or loss
Financial liabilities
measured at amortized cost
Other financial liabilities Total
Loss on valuation/disposal (profit or loss)₩(216,236)₩- ₩- ₩(216,236)
Interest expense - 319,342 190,316 509,658
Foreign exchange differences (profit or loss)- (230,212)43,836 (186,376)