Samsung 2014 Annual Report Download - page 47
Download and view the complete annual report
Please find page 47 of the 2014 Samsung annual report below. You can navigate through the pages in the report by either clicking on the pages listed below, or by using the keyword search tool below to find specific information within the annual report.-
 1
1 -
2
-
3
-
4
-
5
-
6
-
7
-
8
-
9
-
10
-
11
-
12
-
13
-
14
-
15
-
16
-
17
-
18
-
19
-
20
-
21
-
22
-
23
-
24
-
25
-
26
-
27
-
28
-
29
-
30
-
31
-
32
-
33
-
34
-
35
-
36
-
 37
37 -
 38
38 -
 39
39 -
 40
40 -
 41
41 -
 42
42 -
 43
43 -
 44
44 -
 45
45 -
 46
46 -
 47
47 -
 48
48 -
 49
49 -
 50
50 -
 51
51 -
 52
52 -
 53
53 -
 54
54 -
 55
55 -
 56
56 -
 57
57 -
58
-
59
-
60
-
61
-
62
-
63
-
64
-
65
-
66
-
67
-
68
-
69
-
70
-
71
-
72
-
73
-
74
-
75
-
76
-
77
-
78
-
79
-
80
-
81
-
82
-
83
-
84
-
85
-
86
-
87
-
88
-
89
-
90
-
91
-
92
-
93
-
94
-
95
-
96
-
97
-
98
-
99
-
100
-
101
-
102
-
103
-
104
-
105
-
106
-
107
-
108
-
109
-
110
-
111
-
112
-
113
-
114
 |
 |

045044
2014 Samsung Electronics Annual Report2014 Samsung Electronics Annual Report
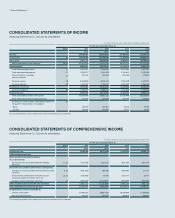
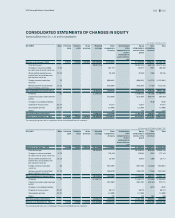
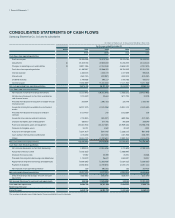
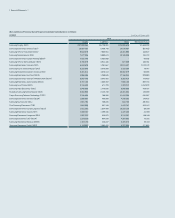
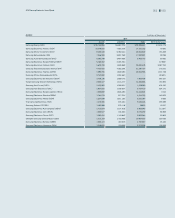
(In thousands of US dollars (Note 2.28))
2014 USD Note Preferred
stock
Common
stock
Share
premium
Retained
earnings
Other
components
of equity
Accumulated
other
comprehensive
income
attributable to
assets held-for-
sale
Equity
attributable
to owners
of the
parent
Non-
controlling
interests
Total
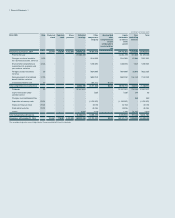
Balance as at January 1, 2014 113,486 739,097 4,183,426 141,161,092 (8,985,535)- 137,211,566 5,294,380 142,505,946
Profit for the year - - - 21,926,949 - - 21,926,949 296,245 22,223,194
Changes in value of available-
for-sale financial assets, net of tax
9, 23 - - - - (298,346)-(298,346)77,861 (220,485)
Share of other comprehensive
income (loss) of associates and
joint ventures, net of tax
12, 23 - - - - (122,062)-(122,062) (415) (122,477)
Foreign currency translation,
net of tax
23 - - - - (907,190)-(907,190)31,291 (875,899)
Remeasurement of net defined
benefit liabilities, net of tax
17, 23 - - - - (659,451)-(659,451) (15,307) (674,758)
Classified as held-for-sale 37 - - - - (76,091)76,091 - - -
Total comprehensive income (loss)
- - - 21,926,949 (2,063,140)76,091 19,939,900 389,675 20,329,575
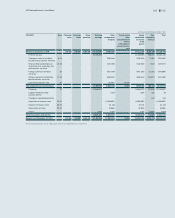
Dividends 22 - - - (2,049,027)- - (2,049,027) (70,500) (2,119,527)
Capital transaction under
common control
- - - - (150)-(150)232 82
Changes in consolidated entities - - - - - - - 541 541
Acquisition of treasury stock 23, 24 - - - - (1,068,987)-(1,068,987)-(1,068,987)
Disposal of treasury stock 23, 24 - - - - 31,124 -31,124 -31,124
Stock option activities 23, 24 - - - - (8,964)-(8,964)-(8,964)
Others - - - 3,642 3,520 -7,162 (3,553)3,609
Total transactions with owners - - - (2,045,385) (1,043,457)-(3,088,842) (73,280) (3,162,122)
Balance as at December 31, 2014 113,486 739,097 4,183,426 161,042,656 (12,092,132)76,091 154,062,624 5,610,775 159,673,399
The accompanying notes are an integral part of these consolidated financial statements.