Samsung 2014 Annual Report Download - page 102
Download and view the complete annual report
Please find page 102 of the 2014 Samsung annual report below. You can navigate through the pages in the report by either clicking on the pages listed below, or by using the keyword search tool below to find specific information within the annual report.-
 1
1 -
2
-
3
-
4
-
5
-
6
-
7
-
8
-
9
-
10
-
11
-
12
-
13
-
14
-
15
-
16
-
17
-
18
-
19
-
20
-
21
-
22
-
23
-
24
-
25
-
26
-
27
-
28
-
29
-
30
-
31
-
32
-
33
-
34
-
35
-
36
-
37
-
38
-
39
-
40
-
41
-
42
-
43
-
44
-
45
-
46
-
47
-
48
-
49
-
50
-
51
-
52
-
53
-
54
-
55
-
56
-
57
-
58
-
59
-
60
-
61
-
62
-
63
-
64
-
65
-
66
-
67
-
68
-
69
-
70
-
71
-
72
-
73
-
74
-
75
-
76
-
77
-
78
-
79
-
80
-
81
-
82
-
83
-
84
-
85
-
86
-
87
-
88
-
89
-
90
-
91
-
 92
92 -
 93
93 -
 94
94 -
 95
95 -
 96
96 -
 97
97 -
 98
98 -
 99
99 -
 100
100 -
 101
101 -
 102
102 -
 103
103 -
 104
104 -
 105
105 -
 106
106 -
 107
107 -
 108
108 -
 109
109 -
 110
110 -
 111
111 -
 112
112 -
113
-
114
 |
 |

Financial Statements
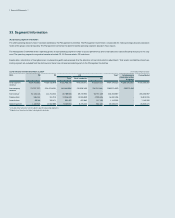
33. Segment Information
(A) Operating segment information
The chief operating decision maker has been identified as the Management Committee. The Management Committee is responsible for making strategic decisions based on
review of the group’s internal reporting. The Management Committee has determined the operating segments based on these reports.
The Management Committee reviews operating profits of each operating segment in order to assess performance and to make decisions about allocating resources to the seg-
ment. The operating segments are product based and include CE, IM, Semiconductor, DP and others.
Depreciation, amortization of intangible assets, and operating profit were prepared after the allocation of internal transaction adjustments. Total assets and liabilities of each op-
erating segment are excluded from the disclosure as these have not been provided regularly to the Management Committee.
(1) For the year eneded December 31, 2014 (In millions of Korean won)
2014 CE IM DS Total1Intercompany
elimination within
the group
Consolidated
Total1Semi conductor DP
Total segment
revenue
₩124,916,892 ₩236,438,979 ₩131,459,756 ₩75,058,071 ₩52,227,615 ₩494,576,550 ₩(288,370,563)₩206,205,987
Intercompany
revenue
(74,733,757) (124,674,435) (65,669,950) (35,328,169) (26,500,446) (288,370,563)288,370,563 -
Net revenue250,183,135 111,764,544 65,789,806 39,729,902 25,727,169 206,205,987 - 206,205,987
Depreciation 596,151 761,214 14,946,633 10,506,903 4,235,596 16,910,026 - 16,910,026
Amortization 98,165 186,471 534,487 402,862 117,139 1,143,395 - 1,143,395
Operating profit 1,184,325 14,562,885 9,430,915 8,776,442 660,181 25,025,071 - 25,025,071
1 Includes other amounts not included in specific operating segments.
2 Segment net revenue includes intersegment revenues.