Samsung 2014 Annual Report Download - page 43
Download and view the complete annual report
Please find page 43 of the 2014 Samsung annual report below. You can navigate through the pages in the report by either clicking on the pages listed below, or by using the keyword search tool below to find specific information within the annual report.-
 1
1 -
2
-
3
-
4
-
5
-
6
-
7
-
8
-
9
-
10
-
11
-
12
-
13
-
14
-
15
-
16
-
17
-
18
-
19
-
20
-
21
-
22
-
23
-
24
-
25
-
26
-
27
-
28
-
29
-
30
-
31
-
32
-
 33
33 -
 34
34 -
 35
35 -
 36
36 -
 37
37 -
 38
38 -
 39
39 -
 40
40 -
 41
41 -
 42
42 -
 43
43 -
 44
44 -
 45
45 -
 46
46 -
 47
47 -
 48
48 -
 49
49 -
 50
50 -
 51
51 -
 52
52 -
 53
53 -
54
-
55
-
56
-
57
-
58
-
59
-
60
-
61
-
62
-
63
-
64
-
65
-
66
-
67
-
68
-
69
-
70
-
71
-
72
-
73
-
74
-
75
-
76
-
77
-
78
-
79
-
80
-
81
-
82
-
83
-
84
-
85
-
86
-
87
-
88
-
89
-
90
-
91
-
92
-
93
-
94
-
95
-
96
-
97
-
98
-
99
-
100
-
101
-
102
-
103
-
104
-
105
-
106
-
107
-
108
-
109
-
110
-
111
-
112
-
113
-
114
 |
 |

041040
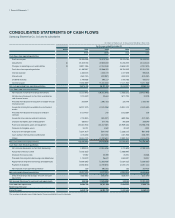
2014 Samsung Electronics Annual Report2014 Samsung Electronics Annual Report
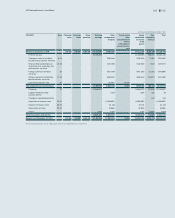
(In millions of Korean won, in thousands of US dollars (Note 2.28))
Notes December 31, 2014 December 31, 2013 December 31, 2014 December 31, 2013
KRW KRW USD USD
Liabilities and Equity
Current liabilities
Trade and other payables 67,914,704 8,437,139 7,518,480 8,014,761
Short-term borrowings 6, 8, 15 8,029,299 6,438,517 7,627,338 6,116,194
Other payables 610,318,407 9,196,566 9,801,850 8,736,170
Advances received 1,427,230 1,706,313 1,355,780 1,620,892
Withholdings 1,161,635 1,176,046 1,103,482 1,117,171
Accrued expenses 12,876,777 11,344,530 12,232,143 10,776,603
Income tax payable 2,161,109 3,386,018 2,052,920 3,216,508
Current portion of long-term liabilities 6, 15, 16 1,778,667 2,425,831 1,689,624 2,304,390
Provisions 18 5,991,510 6,736,476 5,691,565 6,399,236
Other current liabilities 326,259 467,973 309,930 444,548
Liabilities held-for-sale 37 28,316 -26,898 -
Total current liabilities 52,013,913 51,315,409 49,410,010 48,746,473
Non-current liabilities
Debentures 6, 16 1,355,882 1,311,068 1,288,004 1,245,434
Long-term borrowings 6, 15 101,671 985,117 96,581 935,800
Long-term other payables 62,562,271 1,053,756 2,433,999 1,001,003
Net defined benefit liabilities 17 201,342 1,854,902 191,262 1,762,042
Deferred income tax liabilities 29 4,097,811 6,012,371 3,892,667 5,711,381
Provisions 18 499,290 460,924 474,295 437,849
Other non-current liabilities 1,502,590 1,065,461 1,427,368 1,012,122
Total liabilities 62,334,770 64,059,008 59,214,186 60,852,104
Equity attributable to owners of the parent
Preferred stock 20 119,467 119,467 113,486 113,486
Common stock 20 778,047 778,047 739,097 739,097
Share premium 4,403,893 4,403,893 4,183,426 4,183,426
Retained earnings 21 169,529,604 148,600,282 161,042,656 141,161,092
Other components of equity 23 (12,729,387) (9,459,073) (12,092,132) (8,985,535)
Accumulated other comprehensive income
attributable to assets held-for-sale
37 80,101 -76,091 -
Non-controlling interests 162,181,725 144,442,616 154,062,624 137,211,566
5,906,463 5,573,394 5,610,775 5,294,380
Total equity 168,088,188 150,016,010 159,673,399 142,505,946
Total liabilities and equity 230,422,958 214,075,018 218,887,585 203,358,050
The accompanying notes are an integral part of these consolidated financial statements.