Samsung 2014 Annual Report Download - page 93
Download and view the complete annual report
Please find page 93 of the 2014 Samsung annual report below. You can navigate through the pages in the report by either clicking on the pages listed below, or by using the keyword search tool below to find specific information within the annual report.-
 1
1 -
2
-
3
-
4
-
5
-
6
-
7
-
8
-
9
-
10
-
11
-
12
-
13
-
14
-
15
-
16
-
17
-
18
-
19
-
20
-
21
-
22
-
23
-
24
-
25
-
26
-
27
-
28
-
29
-
30
-
31
-
32
-
33
-
34
-
35
-
36
-
37
-
38
-
39
-
40
-
41
-
42
-
43
-
44
-
45
-
46
-
47
-
48
-
49
-
50
-
51
-
52
-
53
-
54
-
55
-
56
-
57
-
58
-
59
-
60
-
61
-
62
-
63
-
64
-
65
-
66
-
67
-
68
-
69
-
70
-
71
-
72
-
73
-
74
-
75
-
76
-
77
-
78
-
79
-
80
-
81
-
82
-
 83
83 -
 84
84 -
 85
85 -
 86
86 -
 87
87 -
 88
88 -
 89
89 -
 90
90 -
 91
91 -
 92
92 -
 93
93 -
 94
94 -
 95
95 -
 96
96 -
 97
97 -
 98
98 -
 99
99 -
 100
100 -
 101
101 -
 102
102 -
 103
103 -
104
-
105
-
106
-
107
-
108
-
109
-
110
-
111
-
112
-
113
-
114
 |
 |

091090
2014 Samsung Electronics Annual Report2014 Samsung Electronics Annual Report
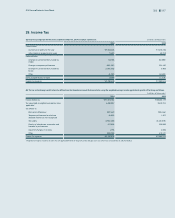
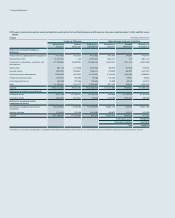
(2) Preferred stock (In millions of Korean won, except per share data, and thousands of number of shares)
2014 2013
Net income available for preferred stock and
preferred stock equivalents
₩3,037,200 ₩3,927,064
Weighted-average number of shares of
preferred stock and dilutive potential
preferred stock
19,849 19,854
Diluted earnings per preferred share ₩153,015 ₩197,800
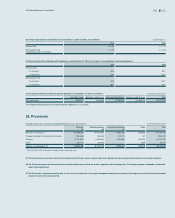
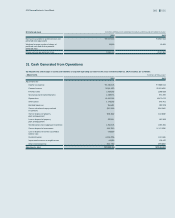
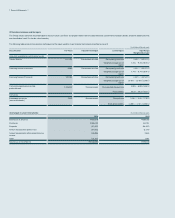
31. Cash Generated from Operations
(A) Adjustments and changes in assets and liabilities arising from operating activities for the years ended December 31, 2014 and 2013, are as follows:
- Adjustments (In millions of Korean won)
2014 2013
Adjustments for:
Income tax expense ₩4,480,676 ₩7,889,515
Financial income (3,094,422) (2,551,623)
Financial costs 1,933,565 1,568,663
Severance and retirement benefits 1,289,973 971,997
Depreciation 16,910,026 15,470,012
Amortization 1,143,395 975,401
Bad debt expenses 365,681 282,978
Gain on valuation of equity method
investments
(342,516) (504,063)
Gain on disposal of property,
plant and equipment
(228,366) (110,638)
Loss on disposal of property,
plant and equipment
222,841 187,863
Obsolescence and scrapping of inventories 1,354,405 1,045,360
Gain on disposal of investments (152,281) (1,117,029)
Loss on disposal of assets classified as
held-for-sale
723,869 -
Dividend income (1,436,235) (112,159)
Impairment losses on intangible assets 65,889 108,420
Other income/expense (912,735) (299,865)
Adjustments, total ₩22,323,765 ₩23,804,832