Samsung 2014 Annual Report Download - page 101
Download and view the complete annual report
Please find page 101 of the 2014 Samsung annual report below. You can navigate through the pages in the report by either clicking on the pages listed below, or by using the keyword search tool below to find specific information within the annual report.-
 1
1 -
2
-
3
-
4
-
5
-
6
-
7
-
8
-
9
-
10
-
11
-
12
-
13
-
14
-
15
-
16
-
17
-
18
-
19
-
20
-
21
-
22
-
23
-
24
-
25
-
26
-
27
-
28
-
29
-
30
-
31
-
32
-
33
-
34
-
35
-
36
-
37
-
38
-
39
-
40
-
41
-
42
-
43
-
44
-
45
-
46
-
47
-
48
-
49
-
50
-
51
-
52
-
53
-
54
-
55
-
56
-
57
-
58
-
59
-
60
-
61
-
62
-
63
-
64
-
65
-
66
-
67
-
68
-
69
-
70
-
71
-
72
-
73
-
74
-
75
-
76
-
77
-
78
-
79
-
80
-
81
-
82
-
83
-
84
-
85
-
86
-
87
-
88
-
89
-
90
-
 91
91 -
 92
92 -
 93
93 -
 94
94 -
 95
95 -
 96
96 -
 97
97 -
 98
98 -
 99
99 -
 100
100 -
 101
101 -
 102
102 -
 103
103 -
 104
104 -
 105
105 -
 106
106 -
 107
107 -
 108
108 -
 109
109 -
 110
110 -
 111
111 -
112
-
113
-
114
 |
 |

099098
2014 Samsung Electronics Annual Report2014 Samsung Electronics Annual Report
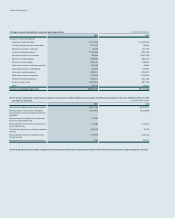
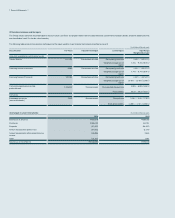
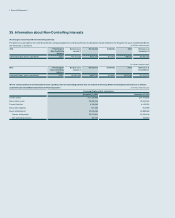
(5) Sensitivity analysis for recurring fair value measurements categorized within Level 3
Sensitivity analysis of financial instruments is performed to measure favorable and unfavorable changes in the fair value of financial instruments which are affected by the unob-
servable parameters, using a statistical technique. When the fair value is affected by more than two input parameters, the amounts represent the most favorable or most unfa-
vorable.
The results of the sensitivity analysis for the effect on profit or loss (before-tax amount for other comprehensive income or loss) from changes in inputs for each financial instru-
ment which is categorized within Level 3 and subject to sensitivity analysis, are as follows: (In mil
lions of Korean won)
Classification Favorable Changes Unfavorable Changes
Profit or Loss Equity Profit or Loss Equity
Long-term available-for-sale financial assets1₩- ₩231,909 ₩- ₩(225,568)
Embedded derivatives
(convertible bonds)2
466 466 (475) (475)
Total ₩466 ₩232,375 ₩(475)₩(226,043)
1 Changes in fair value are calculated by increasing or decreasing the correlation between volatility (30.5% to 36.5%) and discount rate for convertible preferred stock. Similarly, for other equity
securities, changes in fair value are calculated with the correlation between growth ratio (-1% to 1%) and discount rate, which are significant unobservable inputs.
2 For equity derivatives, changes in their fair value are calculated by increasing or decreasing the correlation between stock prices and volatility by 10%.
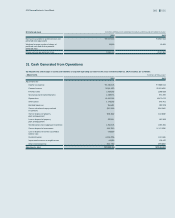
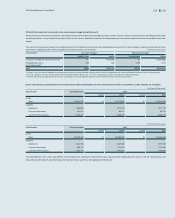
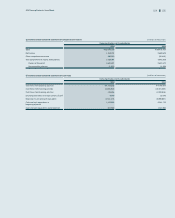
(6) Fair value hierarchy classifications of the financial assets and financial liabilities that are measured at fair value as at December 31, 2014 and 2013, are as follows:
(In millions of Korean won)
Classification Carrying amount 2014
Level 1 Level 2 Level 3 Total
Assets
Other ₩4,614,560 ₩- ₩4,576,852 ₩- ₩4,576,852
Liabilities
Debentures 1,355,882 - 1,377,113 - 1,377,113
Long-term borrowings 101,671 - 82,271 - 82,271
Long-term other payables 2,520,277 - 2,606,179 - 2,606,179
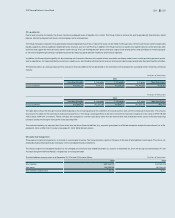
(In millions of Korean won)
Classification Carrying amount 2013
Level 1 Level 2 Level 3 Total
Assets
Other ₩5,432,404 ₩-₩5,395,918 ₩-₩5,395,918
Liabilities
Debentures 1,311,068 -1,327,569 -1,327,569
Long-term borrowings 985,117 -971,844 -971,844
Long-term other payables 1,023,714 -1,090,580 -1,090,580
As at December 31, 2014, assets and liabilities not measured at fair value but for which the fair value is disclosed and categorized within Level 2 in the fair value hierarchy, are
measured using the present value technique which discounts future cash flows with appropriate interest rates.