Samsung 2014 Annual Report Download - page 69
Download and view the complete annual report
Please find page 69 of the 2014 Samsung annual report below. You can navigate through the pages in the report by either clicking on the pages listed below, or by using the keyword search tool below to find specific information within the annual report.-
 1
1 -
2
-
3
-
4
-
5
-
6
-
7
-
8
-
9
-
10
-
11
-
12
-
13
-
14
-
15
-
16
-
17
-
18
-
19
-
20
-
21
-
22
-
23
-
24
-
25
-
26
-
27
-
28
-
29
-
30
-
31
-
32
-
33
-
34
-
35
-
36
-
37
-
38
-
39
-
40
-
41
-
42
-
43
-
44
-
45
-
46
-
47
-
48
-
49
-
50
-
51
-
52
-
53
-
54
-
55
-
56
-
57
-
58
-
 59
59 -
 60
60 -
 61
61 -
 62
62 -
 63
63 -
 64
64 -
 65
65 -
 66
66 -
 67
67 -
 68
68 -
 69
69 -
 70
70 -
 71
71 -
 72
72 -
 73
73 -
 74
74 -
 75
75 -
 76
76 -
 77
77 -
 78
78 -
 79
79 -
80
-
81
-
82
-
83
-
84
-
85
-
86
-
87
-
88
-
89
-
90
-
91
-
92
-
93
-
94
-
95
-
96
-
97
-
98
-
99
-
100
-
101
-
102
-
103
-
104
-
105
-
106
-
107
-
108
-
109
-
110
-
111
-
112
-
113
-
114
 |
 |
067066
2014 Samsung Electronics Annual Report2014 Samsung Electronics Annual Report
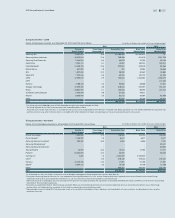
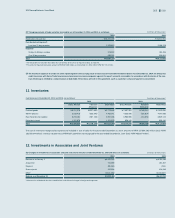
(1) Equity securities - Listed
Details of listed equity securities as at December 31, 2014 and 2013, are as follows: (In millions of Korean won, number of shares and percentage)
2014 2013
Number of
Shares Owned
Percentage of
Ownership (%)
Acquisition Cost Book Value
(Market Value)
Book Value
(Market Value)
Samsung SDI 13,462,673 19.6 ₩2,180,953 ₩1,561,670 ₩-
Samsung Heavy Industries 40,675,641 17.6 258,299 811,479 1,547,708
Samsung Fine Chemicals 2,164,970 8.4 45,678 70,795 96,449
Hotel Shilla 2,004,717 5.1 13,957 183,231 133,314
Cheil Worldwide114,498,725 12.6 223,941 249,378 82,465
iMarket Korea 647,320 1.8 324 18,384 16,668
SFA 1,822,000 10.2 38,262 90,462 74,884
Wonik IPS 7,220,216 9.0 63,250 100,722 61,949
ASML 12,595,575 2.9 726,024 1,506,664 1,248,019
CSR2- -- - 110,135
Rambus 4,788,125 4.2 92,682 58,368 47,851
Seagate Technology 12,539,490 3.8 218,544 916,597 743,161
Sharp 35,804,000 2.1 122,535 88,292 120,143
SunEdison Semiconductor 2,425,578 5.8 37,553 49,511 -
Wacom 8,398,400 5.0 62,013 36,084 62,268
Other 51,837 35,199 54,300
Total ₩4,135,852 ₩5,776,836 ₩4,399,314
1 The Group acquired 11,500,000 shares of Cheil Worldwide during the year ended December 31, 2014.
2 The Group disposed all of its CSR shares during the year ended December 31, 2014.
Acquisition cost includes impairment loss on available-for-sale financial assets recognized due to the decline in realizable value below acquisition cost. The difference between the acquisition cost
and the current fair value, after income tax effects, is recorded within other components of equity (unrealized gains or losses on available-for-sale financial assets).
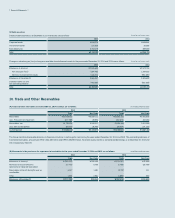
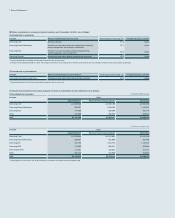
(2) Equity securities - Non-listed
Details of non-listed equity securities as at December 31, 2014 and 2013, are as follows: (In millions of Korean won, number of shares and percentage)
2014 2013
Number of
Shares Owned
Percentage of
Ownership (%)
Acquisition Cost Book Value Book Value
Kihyup Technology 1,000,000 17.2 ₩5,000 ₩5,000 ₩5,000
Pusan Newport11,135,307 1.0 5,677 5,677 5,677
Samsung Venture Investment 980,000 16.3 4,900 6,586 7,021
Samsung Petrochemical2- -- - 80,347
Samsung General Chemicals2- -- - 80,653
Taewon Electric 45,000 15.0 16,544 17,094 17,072
Pantech353,000,000 10.0 53,000 - 53,053
Corning Inc.42,300 7.4 2,434,320 3,106,332 -
CSOT5- 9.5 278,130 278,130 278,130
Nanosys 13,100,436 11.2 17,861 21,786 17,861
OpenX58,899,172 3.2 10,738 10,738 10,738
Other3339,361 295,050 226,745
Total ₩3,165,531 ₩3,746,393 ₩782,297
1 As at December 31, 2014, the Group’s investments in Pusan Newport are pledged as collateral against the investee's debt (Note 19).
2 During 2014, Samsung General Chemicals Co., Ltd. merged with Samsung Petrochemical Co., Ltd., and the Group entered into an agreement with Hanwha Chemical and Hanwha Energy
Corporation to sell all of its Samsung General Chemincals Co., Ltd. As a result, the shares are reclassified as assets held-for-sale.
3 Impairment losses on unlisted equity securities resulting from the decline in realizable value below the acquisition cost amounted to KRW 58,357 million and KRW 5,177 million for the years ended
December 31, 2014 and 2013, respectively.
4 During the year ended December 31, 2014, the Group acquired 2,300 shares of convertible preferred shares of Corning Incorporated, which are convertible into common shares. Percentage
of ownership is calculated under the assumption that all shares have been converted into common shares.
5 Nonmarketable shares, including CSOT, are measured at cost as the variability of estimated cash flow is significant and the probability of various estimates, including discount rate, cannot be
reasonably assessed.