Samsung 2014 Annual Report Download - page 46
Download and view the complete annual report
Please find page 46 of the 2014 Samsung annual report below. You can navigate through the pages in the report by either clicking on the pages listed below, or by using the keyword search tool below to find specific information within the annual report.-
 1
1 -
2
-
3
-
4
-
5
-
6
-
7
-
8
-
9
-
10
-
11
-
12
-
13
-
14
-
15
-
16
-
17
-
18
-
19
-
20
-
21
-
22
-
23
-
24
-
25
-
26
-
27
-
28
-
29
-
30
-
31
-
32
-
33
-
34
-
35
-
 36
36 -
 37
37 -
 38
38 -
 39
39 -
 40
40 -
 41
41 -
 42
42 -
 43
43 -
 44
44 -
 45
45 -
 46
46 -
 47
47 -
 48
48 -
 49
49 -
 50
50 -
 51
51 -
 52
52 -
 53
53 -
 54
54 -
 55
55 -
 56
56 -
57
-
58
-
59
-
60
-
61
-
62
-
63
-
64
-
65
-
66
-
67
-
68
-
69
-
70
-
71
-
72
-
73
-
74
-
75
-
76
-
77
-
78
-
79
-
80
-
81
-
82
-
83
-
84
-
85
-
86
-
87
-
88
-
89
-
90
-
91
-
92
-
93
-
94
-
95
-
96
-
97
-
98
-
99
-
100
-
101
-
102
-
103
-
104
-
105
-
106
-
107
-
108
-
109
-
110
-
111
-
112
-
113
-
114
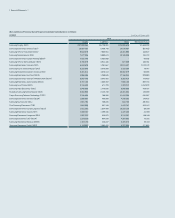
 |
 |

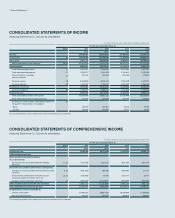
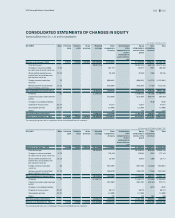
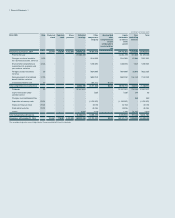
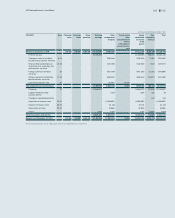
Financial Statements
(In millions of Korean won)
2014 KRW Note Preferred
stock
Common
stock
Share
premium
Retained
earnings
Other
components
of equity
Accumulated
other
comprehensive
income
attributable to
assets held-for-
sale
Equity
attributable
to owners
of the
parent
Non-
controlling
interests
Total
Balance as at January 1, 2014 119,467 778,047 4,403,893 148,600,282 (9,459,073)- 144,442,616 5,573,394 150,016,010
Profit for the year - - - 23,082,499 - - 23,082,499 311,859 23,394,358
Changes in value of available-
for-sale financial assets, net of tax
9, 23 - - - - (314,069)-(314,069)81,964 (232,105)
Share of other comprehensive
income (loss) of associates and
joint ventures, net of tax
12, 23 - - - - (128,495)-(128,495) (437) (128,932)
Foreign currency translation,
net of tax
23 - - - - (954,999)-(954,999)32,940 (922,059)
Remeasurement of net defined
benefit liabilities, net of tax
17, 23 - - - - (694,204)-(694,204) (16,114) (710,318)
Classified as held-for-sale 37 - - - - (80,101)80,101 - - -
Total comprehensive income (loss)
- - - 23,082,499 (2,171,868)80,101 20,990,732 410,212 21,400,944
Dividends 22 - - - (2,157,011)- - (2,157,011) (74,216) (2,231,227)
Capital transaction under
common control
- - - - (158)-(158)244 86
Changes in consolidated entities - - - - - - - 569 569
Acquisition of treasury stock 23, 24 - - - - (1,125,322)-(1,125,322)-(1,125,322)
Disposal of treasury stock 23, 24 - - - - 32,764 -32,764 -32,764
Stock option activities 23, 24 - - - - (9,436)-(9,436)-(9,436)
Others - - - 3,834 3,706 -7,540 (3,740)3,800
Total transactions with owners - - - (2,153,177) (1,098,446)-(3,251,623) (77,143) (3,328,766)
Balance as at December 31, 2014 119,467 778,047 4,403,893 169,529,604 (12,729,387)80,101 162,181,725 5,906,463 168,088,188
The accompanying notes are an integral part of these consolidated financial statements.