Samsung 2014 Annual Report Download - page 97
Download and view the complete annual report
Please find page 97 of the 2014 Samsung annual report below. You can navigate through the pages in the report by either clicking on the pages listed below, or by using the keyword search tool below to find specific information within the annual report.-
 1
1 -
2
-
3
-
4
-
5
-
6
-
7
-
8
-
9
-
10
-
11
-
12
-
13
-
14
-
15
-
16
-
17
-
18
-
19
-
20
-
21
-
22
-
23
-
24
-
25
-
26
-
27
-
28
-
29
-
30
-
31
-
32
-
33
-
34
-
35
-
36
-
37
-
38
-
39
-
40
-
41
-
42
-
43
-
44
-
45
-
46
-
47
-
48
-
49
-
50
-
51
-
52
-
53
-
54
-
55
-
56
-
57
-
58
-
59
-
60
-
61
-
62
-
63
-
64
-
65
-
66
-
67
-
68
-
69
-
70
-
71
-
72
-
73
-
74
-
75
-
76
-
77
-
78
-
79
-
80
-
81
-
82
-
83
-
84
-
85
-
86
-
 87
87 -
 88
88 -
 89
89 -
 90
90 -
 91
91 -
 92
92 -
 93
93 -
 94
94 -
 95
95 -
 96
96 -
 97
97 -
 98
98 -
 99
99 -
 100
100 -
 101
101 -
 102
102 -
 103
103 -
 104
104 -
 105
105 -
 106
106 -
 107
107 -
108
-
109
-
110
-
111
-
112
-
113
-
114
 |
 |

095094
2014 Samsung Electronics Annual Report2014 Samsung Electronics Annual Report
(C) Liquidity risk
Due to large investments made by the Group, maintaining adequate levels of liquidity risk is critical. The Group strives to achieve this goal by periodically forecasting its capital
balance, estimating required cash levels, and managing income and expenses.
The Group manages its liquidity risk by periodically forecasting projected cash flows. If abnormal signs are identified, the Group works with the local finance center and provides
liquidity support by utilizing a globally integrated finance structure, such as Cash Pooling. In addition, the Group maintains a liquidity management process which provides addi-
tional financial support by the local finance center and the Group. The Cash Pooling program allows sharing of surplus funds among entities and contributes to minimizing liquid-
ity risk and strengthening the Group’s competitive position by reducing capital operation expenses and financial expenses.
In addition, the Group mitigates liquidity risk by contracting with financial institutions with respect to bank overdrafts and foreign trade finance, and by providing payment guaran-
tees to subsidiaries. For large scale facility investments, liquidity risk is minimized by utilizing internal reserves and long term borrowings according to the capital injection schedule.
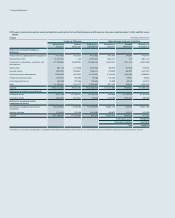
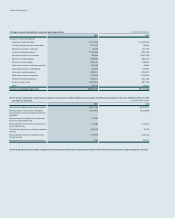
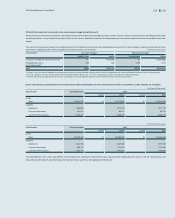
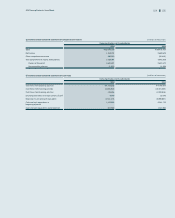
The following table is an undiscounted cash flow analysis for financial liabilities that are presented on the statements of financial position according to their remaining contractual
maturity.
(In millions of Korean won)
2014
Less than 3 months 4 - 6 months 7 - 12 months 1 - 5 years More than 5 years
Financial liabilities ₩34,502,783 ₩706,077 ₩3,528,699 ₩3,994,862 ₩106,857
(In millions of Korean won)
2013
Less than 3 months 4 - 6 months 7 - 12 months 1 - 5 years More than 5 years
Financial liabilities ₩33,862,896 ₩1,095,285 ₩4,806,477 ₩2,564,769 ₩65,772
The table above shows the Group’s financial liabilities based on the remaining period at the statement of financial position date until the contractual maturity date. The amounts
disclosed in the table are the contractual undiscounted cash flows. The Group’s trading portfolio of derivative instruments has been included at its fair value of KRW 78,348
million (2013: KRW 244,172 million). These contracts are managed on a net-fair value basis rather than by maturity date. Net settled derivatives consist of forward exchange
contracts used by the Group to manage the exchange rate profile.
The maximum liquidity risk exposure from those other than the above financial liabilities (e.g., payment guarantees for affiliated companies and performance bonds) as at De-
cember 31, 2014 is KRW 115,211 million (December 31, 2013: KRW 183,644 million).
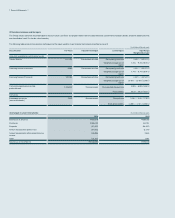
(D) Capital risk management
The purpose of capital management is to maintain a sound capital structure. The Group monitors capital on the basis of the ratio of total liabilities to total equity. This ratio is cal-
culated by dividing total liabilities by total equity in the consolidated financial statements.
The Group’s capital risk management policy has not changed since the fiscal year ended December 31, 2013. As at December 31, 2014, the Group has maintained an A+ and
A1 credit rating from S&P and Moody’s, respectively, on its long term debt.
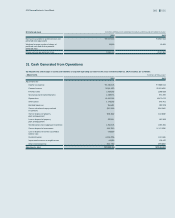
The total liabilities to equity ratios as at December 31, 2014 and 2013, are as follows: (In millions of Korean won)
2014 2013
Total liabilities ₩62,334,770 ₩64,059,008
Total equity 168,088,188 150,016,010
Total liabilities to equity ratio 37.1% 42.7%