Samsung 2014 Annual Report Download - page 106
Download and view the complete annual report
Please find page 106 of the 2014 Samsung annual report below. You can navigate through the pages in the report by either clicking on the pages listed below, or by using the keyword search tool below to find specific information within the annual report.-
 1
1 -
2
-
3
-
4
-
5
-
6
-
7
-
8
-
9
-
10
-
11
-
12
-
13
-
14
-
15
-
16
-
17
-
18
-
19
-
20
-
21
-
22
-
23
-
24
-
25
-
26
-
27
-
28
-
29
-
30
-
31
-
32
-
33
-
34
-
35
-
36
-
37
-
38
-
39
-
40
-
41
-
42
-
43
-
44
-
45
-
46
-
47
-
48
-
49
-
50
-
51
-
52
-
53
-
54
-
55
-
56
-
57
-
58
-
59
-
60
-
61
-
62
-
63
-
64
-
65
-
66
-
67
-
68
-
69
-
70
-
71
-
72
-
73
-
74
-
75
-
76
-
77
-
78
-
79
-
80
-
81
-
82
-
83
-
84
-
85
-
86
-
87
-
88
-
89
-
90
-
91
-
92
-
93
-
94
-
95
-
 96
96 -
 97
97 -
 98
98 -
 99
99 -
 100
100 -
 101
101 -
 102
102 -
 103
103 -
 104
104 -
 105
105 -
 106
106 -
 107
107 -
 108
108 -
 109
109 -
 110
110 -
 111
111 -
 112
112 -
 113
113 -
 114
114
 |
 |

Financial Statements
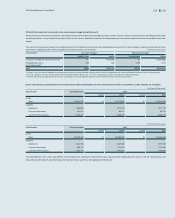
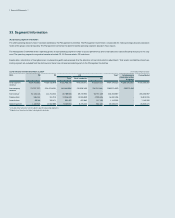
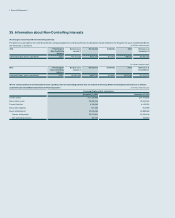
35. Information about Non-Controlling Interests
(A) Changes in accumulated non-controlling interests
The profit or loss allocated to non-controlling interests and accumulated non-controlling interests of subsidiaries that are material to the Group for the years ended December 31,
2014 and 2013, is as follows: (In millions of Korean won)
2014 Percentage of
Non-Controlling
Interests
Balance as at
January 1
Net Income Dividends Other Balance as at
December 31
Samsung Display and its subsidiaries 15.2% ₩5,104,125 ₩171,178 ₩(1,851)₩86,740 ₩5,360,192
(In millions of Korean won)
2013 Percentage of
Non-Controlling
Interests
Balance as at
January 1
Net Income Dividends Other Balance as at
December 31
Samsung Display and its subsidiaries 15.2% ₩4,061,948 ₩433,700 ₩(1,553)₩610,030 ₩5,104,125
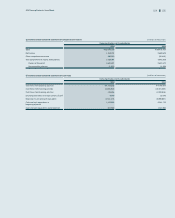
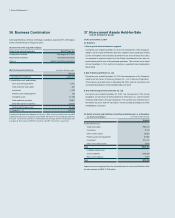
(B) The summarized financial information for each subsidiary with non-controlling interests that are material to the Group before intercompany eliminations is as follows:
(1) Summarized consolidated statements of financial position (In millions of Korean won)
Samsung Display and its subsidiaries
December 31, 2014 December 31, 2013
Current assets ₩14,185,656 ₩14,473,616
Non-current assets 25,380,046 23,454,045
Current liabilities 6,158,562 6,115,203
Non-current liabilities 871,085 914,399
Equity attributable to: 32,536,055 30,898,059
Owners of the parent 32,073,951 30,434,116
Non-controlling interests 462,104 463,943