Samsung 2014 Annual Report Download - page 107
Download and view the complete annual report
Please find page 107 of the 2014 Samsung annual report below. You can navigate through the pages in the report by either clicking on the pages listed below, or by using the keyword search tool below to find specific information within the annual report.-
 1
1 -
2
-
3
-
4
-
5
-
6
-
7
-
8
-
9
-
10
-
11
-
12
-
13
-
14
-
15
-
16
-
17
-
18
-
19
-
20
-
21
-
22
-
23
-
24
-
25
-
26
-
27
-
28
-
29
-
30
-
31
-
32
-
33
-
34
-
35
-
36
-
37
-
38
-
39
-
40
-
41
-
42
-
43
-
44
-
45
-
46
-
47
-
48
-
49
-
50
-
51
-
52
-
53
-
54
-
55
-
56
-
57
-
58
-
59
-
60
-
61
-
62
-
63
-
64
-
65
-
66
-
67
-
68
-
69
-
70
-
71
-
72
-
73
-
74
-
75
-
76
-
77
-
78
-
79
-
80
-
81
-
82
-
83
-
84
-
85
-
86
-
87
-
88
-
89
-
90
-
91
-
92
-
93
-
94
-
95
-
96
-
 97
97 -
 98
98 -
 99
99 -
 100
100 -
 101
101 -
 102
102 -
 103
103 -
 104
104 -
 105
105 -
 106
106 -
 107
107 -
 108
108 -
 109
109 -
 110
110 -
 111
111 -
 112
112 -
 113
113 -
 114
114
 |
 |

105104
2014 Samsung Electronics Annual Report2014 Samsung Electronics Annual Report
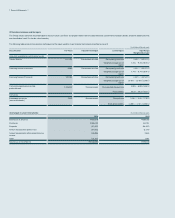
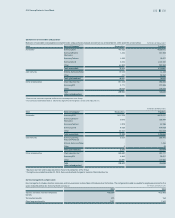
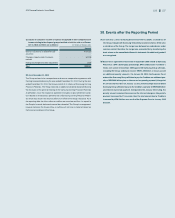
(2) Summarized consolidated statements of comprehensive income (In millions of Korean won)
Samsung Display and its subsidiaries
2014 2013
Sales ₩25,646,109 ₩29,478,707
Net income 1,153,734 2,669,623
Other comprehensive income 485,350 (26,415)
Total comprehensive income attributable to: 1,639,084 2,643,208
Owners of the parent 1,640,637 2,631,672
Non-controlling interests (1,553)11,536
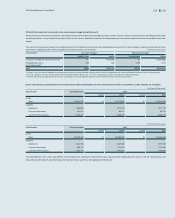
(3) Summarized consolidated statements of cash flows (In millions of Korean won)
Samsung Display and its subsidiaries
2014 2013
Cash flows from operating activities ₩4,722,526 ₩7,748,974
Cash flows from investing activities (6,269,805) (10,321,562)
Cash flows from financing activities 416,556 (1,339,815)
Exchange rate effect on foreign currency (cash)9,249 13,546
Decrease in cash and cash equivalents (1,121,474) (3,898,857)
Cash and cash equivalents at
beginning of period
1,442,856 5,341,713
Cash and cash equivalents at end of period 321,382 1,442,856