Samsung 2014 Annual Report Download - page 48
Download and view the complete annual report
Please find page 48 of the 2014 Samsung annual report below. You can navigate through the pages in the report by either clicking on the pages listed below, or by using the keyword search tool below to find specific information within the annual report.-
 1
1 -
2
-
3
-
4
-
5
-
6
-
7
-
8
-
9
-
10
-
11
-
12
-
13
-
14
-
15
-
16
-
17
-
18
-
19
-
20
-
21
-
22
-
23
-
24
-
25
-
26
-
27
-
28
-
29
-
30
-
31
-
32
-
33
-
34
-
35
-
36
-
37
-
 38
38 -
 39
39 -
 40
40 -
 41
41 -
 42
42 -
 43
43 -
 44
44 -
 45
45 -
 46
46 -
 47
47 -
 48
48 -
 49
49 -
 50
50 -
 51
51 -
 52
52 -
 53
53 -
 54
54 -
 55
55 -
 56
56 -
 57
57 -
 58
58 -
59
-
60
-
61
-
62
-
63
-
64
-
65
-
66
-
67
-
68
-
69
-
70
-
71
-
72
-
73
-
74
-
75
-
76
-
77
-
78
-
79
-
80
-
81
-
82
-
83
-
84
-
85
-
86
-
87
-
88
-
89
-
90
-
91
-
92
-
93
-
94
-
95
-
96
-
97
-
98
-
99
-
100
-
101
-
102
-
103
-
104
-
105
-
106
-
107
-
108
-
109
-
110
-
111
-
112
-
113
-
114
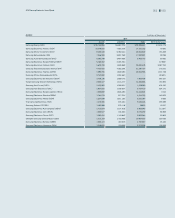
 |
 |

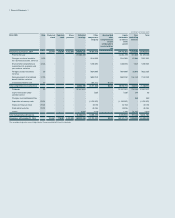
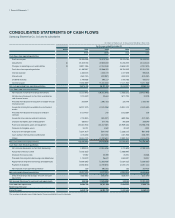
Financial Statements
CONSOLIDATED STATEMENTS OF CASH FLOWS
Samsung Electronics Co., Ltd. and its subsidiaries
(In millions of Korean won, in thousands of US dollars (Note 2.28)
For the year ended December 31,
Notes 2014 2013 2014 2013
KRW KRW USD USD
Cash flows from operating activities
Profit for the year 23,394,358 30,474,764 22,223,194 28,949,145
Adjustments 31 22,323,765 23,804,832 21,206,200 22,613,120
Changes in operating assets and liabilities 31 (3,837,136) (1,313,245) (3,645,042) (1,247,502)
Cash flows from operating activities 41,880,987 52,966,351 39,784,352 50,314,763
Interest received 1,555,373 1,034,074 1,477,508 982,306
Interest paid (463,740) (434,857) (440,524) (413,087)
Dividend received 1,495,658 592,217 1,420,783 562,570
Income tax paid (7,492,889) (7,450,345) (7,117,782) (7,077,368)
Net cash generated from operating activities 36,975,389 46,707,440 35,124,337 44,369,184
Cash flows from investing activities
Net increase in short-term financial instruments (1,110,842) (19,391,643) (1,055,231) (18,420,863)
Net decrease (increase) in short-term available-for-
sale financial assets
(713,452)33,663 (677,735)31,978
Proceeds from disposal of long-term available-for-sale
financial assets
202,904 1,691,463 192,746 1,606,785
Acquisition of long-term available-for-sale financial
assets
(6,212,102) (1,531,356) (5,901,113) (1,454,694)
Proceeds from disposal of associates and joint
ventures
2,014,430 240 1,913,584 228
Acquisition of associates and joint ventures (719,800) (181,307) (683,766) (172,230)
Disposal of property, plant and equipment 385,610 377,445 366,306 358,549
Purchases of property, plant and equipment (22,042,943) (23,157,587) (20,939,435) (21,998,278)
Disposal of intangible assets 31,731 4,562 30,142 4,334
Purchases of intangible assets (1,324,307) (934,743) (1,258,010) (887,948)
Cash outflows from business combination (176,625) (167,155) (167,783) (158,787)
Others (3,141,012) (1,490,601) (2,983,767) (1,415,979)
Net cash used in investing activities (32,806,408) (44,747,019) (31,164,062) (42,506,905)
Cash flows from financing activities
Net increase (decrease) in short-term borrowings 1,833,419 (1,861,536)1,741,635 (1,768,344)
Acquisition of treasury stock (1,125,322)-(1,068,986)-
Disposal of treasury stock 27,582 34,390 26,201 32,668
Proceeds from long-term borrowings and debentures 1,740,573 26,672 1,653,437 25,337
Repayment of long-term borrowings and debentures (3,299,595) (1,368,436) (3,134,412) (1,299,930)
Payment of dividends (2,233,905) (1,249,672) (2,122,072) (1,187,111)
Net increase in non-controlling interests 139 281,551 132 267,456
Net cash used in financing activities (3,057,109) (4,137,031) (2,904,065)(3,929,924)
Effect of exchange rate changes on cash and cash
equivalents
(555,886) (330,070) (528,057) (313,546)
Net increase (decrease) in cash and cash equivalents 555,986 (2,506,680)528,153 (2,381,191)
Cash and cash equivalents
Beginning of the year
16,284,780 18,791,460 15,469,535 17,850,726
End of the year 16,840,766 16,284,780 15,997,688 15,469,535
The accompanying notes are an integral part of these consolidated financial statements.