Samsung 2014 Annual Report Download - page 75
Download and view the complete annual report
Please find page 75 of the 2014 Samsung annual report below. You can navigate through the pages in the report by either clicking on the pages listed below, or by using the keyword search tool below to find specific information within the annual report.-
 1
1 -
2
-
3
-
4
-
5
-
6
-
7
-
8
-
9
-
10
-
11
-
12
-
13
-
14
-
15
-
16
-
17
-
18
-
19
-
20
-
21
-
22
-
23
-
24
-
25
-
26
-
27
-
28
-
29
-
30
-
31
-
32
-
33
-
34
-
35
-
36
-
37
-
38
-
39
-
40
-
41
-
42
-
43
-
44
-
45
-
46
-
47
-
48
-
49
-
50
-
51
-
52
-
53
-
54
-
55
-
56
-
57
-
58
-
59
-
60
-
61
-
62
-
63
-
64
-
 65
65 -
 66
66 -
 67
67 -
 68
68 -
 69
69 -
 70
70 -
 71
71 -
 72
72 -
 73
73 -
 74
74 -
 75
75 -
 76
76 -
 77
77 -
 78
78 -
 79
79 -
 80
80 -
 81
81 -
 82
82 -
 83
83 -
 84
84 -
 85
85 -
86
-
87
-
88
-
89
-
90
-
91
-
92
-
93
-
94
-
95
-
96
-
97
-
98
-
99
-
100
-
101
-
102
-
103
-
104
-
105
-
106
-
107
-
108
-
109
-
110
-
111
-
112
-
113
-
114
 |
 |

073072
2014 Samsung Electronics Annual Report2014 Samsung Electronics Annual Report
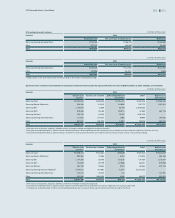
(In millions of Korean won)
Investee 2013
Samsung Card1Samsung Electro-
Mechanics
Samsung SDI Samsung SDS Samsung Techwin
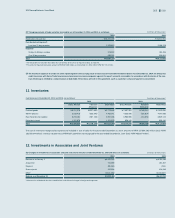
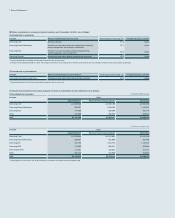
1. Condensed financial information
Condensed statement of financial position:
Current assets ₩16,560,926 ₩2,650,765 ₩2,063,192 ₩2,928,998 ₩1,561,706
Non-current assets 4,534,578 8,492,479 2,371,102 1,872,518
Current liabilities 10,358,265 1,787,432 1,526,957 1,219,484 1,169,253
Non-current liabilities 1,139,884 1,486,297 197,222 560,191
Non-controlling interests -83,966 164,323 80,644 1,628
Condensed statement of comprehensive
income:
Revenue 2,847,053 8,256,579 5,016,465 7,046,833 2,912,031
Profit from continuing operations2273,232 330,240 130,599 312,372 132,493
Other comprehensive income (loss)284,153 26,676 (63,211) (88,703)21,596
Total comprehensive income2357,385 356,916 67,388 223,669 154,089
2. Details of adjustments from the book value
of investments in associates
Net assets (a)6,202,661 4,174,061 7,378,094 3,802,750 1,703,152
Ownership percentage (b)337.5% 22.8% 19.7% 22.6% 25.5%
Net assets of equity shares (a x b)2,322,897 951,693 1,451,770 858,671 433,624
Goodwill 17,181 - - 26,801 -
Intercompany transactions (69)2,803 (276,566) (5,516) (30,879)
Book value of associates 2,340,009 954,496 1,175,204 879,956 402,745
3. Dividends from associates
Dividends ₩30,375 ₩17,693 ₩13,924 ₩3,914 ₩6,763
1 Samsung Card does not present current and non-current assets and liabilities as separate classifications in its statement of financial position.
2 Income (loss) attributable to owners of the parent.
3 Ownership percentage includes common and preferred stock.