Samsung 2014 Annual Report Download - page 95
Download and view the complete annual report
Please find page 95 of the 2014 Samsung annual report below. You can navigate through the pages in the report by either clicking on the pages listed below, or by using the keyword search tool below to find specific information within the annual report.-
 1
1 -
2
-
3
-
4
-
5
-
6
-
7
-
8
-
9
-
10
-
11
-
12
-
13
-
14
-
15
-
16
-
17
-
18
-
19
-
20
-
21
-
22
-
23
-
24
-
25
-
26
-
27
-
28
-
29
-
30
-
31
-
32
-
33
-
34
-
35
-
36
-
37
-
38
-
39
-
40
-
41
-
42
-
43
-
44
-
45
-
46
-
47
-
48
-
49
-
50
-
51
-
52
-
53
-
54
-
55
-
56
-
57
-
58
-
59
-
60
-
61
-
62
-
63
-
64
-
65
-
66
-
67
-
68
-
69
-
70
-
71
-
72
-
73
-
74
-
75
-
76
-
77
-
78
-
79
-
80
-
81
-
82
-
83
-
84
-
 85
85 -
 86
86 -
 87
87 -
 88
88 -
 89
89 -
 90
90 -
 91
91 -
 92
92 -
 93
93 -
 94
94 -
 95
95 -
 96
96 -
 97
97 -
 98
98 -
 99
99 -
 100
100 -
 101
101 -
 102
102 -
 103
103 -
 104
104 -
 105
105 -
106
-
107
-
108
-
109
-
110
-
111
-
112
-
113
-
114
 |
 |

093092
2014 Samsung Electronics Annual Report2014 Samsung Electronics Annual Report
32. Financial Risk Management
The Group’s financial risk management focuses on minimizing market risk, credit risk, and liquidity risk arising from operating activities. To mitigate these risks, the Group imple-
ments and operates a financial risk policy and program that closely monitors and manages such risks.
The finance team mainly carries out the Group’s financial risk management. With the cooperation of the Group’s divisions, domestic and foreign subsidiaries, the finance team
periodically measures, evaluates and hedges financial risk and also establishes and implements the global financial risk management policy.
Also, financial risk management officers are dispatched to the regional headquarters of each area including the United States, England, Singapore, China, Japan, Brazil and
Russia to operate the local finance center in accordance with global financial risk management.
The Group’s financial assets that are under financial risk management are comprised of cash and cash equivalents, short-term financial instruments, available-for-sale financial as-
sets, trade and other receivables and other financial assets. The Group’s financial liabilities under financial risk management are comprised of trade and other payables, borrowings,
debentures, and other financial liabilities.
(A) Market risk
(1) Foreign exchange risk
The Group is exposed to foreign exchange risk arising from various currency exposures, primarily with respect to the United States, European Union, South America, Japan and
other Asian countries. Revenues and expenses arise from foreign currency transactions and exchange positions, and the most widely used currencies are the US Dollar, EU’s
EURO, Japanese Yen and Chinese Yuan. Foreign exchange risk management of the Group is carried out by both SEC and its subsidiaries. To minimize foreign exchange risk
arising from operating activities, the Group’s foreign exchange management policy requires normal business transactions to be in local currency or for the cash-in currency to be
matched up with the cash-out currency. The Group’s foreign exchange risk management policy also defines foreign exchange risk, measuring period, controlling responsibilities,
management procedures, hedging period and hedge ratio.
The Group limits all speculative foreign exchange transactions and operates a system to manage receivables and payables denominated in foreign currency. It evaluates, man-
ages and reports foreign currency exposures to receivables and payables.
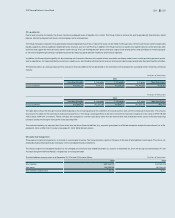
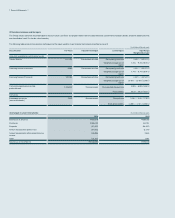
The foreign currency exposure to financial assets and liabilities of a 5% currency rate change against the Korean won are presented below: (In millions of Korean won)
2014 2013
Increase Decrease Increase Decrease
USD ₩(171,265)₩171,265 ₩8,472 ₩(8,472)
EUR (36,381)36,381 9,136 (9,136)
JPY (42,529)42,529 (45,131)45,131
(2) Price risk
The Group’s investment portfolio consists of direct and indirect investments in equity securities classified as available-for-sale, which is in line with the Group’s strategy.
As at December 31, 2014 and 2013, a price fluctuation in relation to marketable equity securities by 1% would result in changes in other comprehensive income (before income
tax) of KRW 57,768 million and KRW 43,993 million, respectively.