Samsung 2014 Annual Report Download - page 70
Download and view the complete annual report
Please find page 70 of the 2014 Samsung annual report below. You can navigate through the pages in the report by either clicking on the pages listed below, or by using the keyword search tool below to find specific information within the annual report.-
 1
1 -
2
-
3
-
4
-
5
-
6
-
7
-
8
-
9
-
10
-
11
-
12
-
13
-
14
-
15
-
16
-
17
-
18
-
19
-
20
-
21
-
22
-
23
-
24
-
25
-
26
-
27
-
28
-
29
-
30
-
31
-
32
-
33
-
34
-
35
-
36
-
37
-
38
-
39
-
40
-
41
-
42
-
43
-
44
-
45
-
46
-
47
-
48
-
49
-
50
-
51
-
52
-
53
-
54
-
55
-
56
-
57
-
58
-
59
-
 60
60 -
 61
61 -
 62
62 -
 63
63 -
 64
64 -
 65
65 -
 66
66 -
 67
67 -
 68
68 -
 69
69 -
 70
70 -
 71
71 -
 72
72 -
 73
73 -
 74
74 -
 75
75 -
 76
76 -
 77
77 -
 78
78 -
 79
79 -
 80
80 -
81
-
82
-
83
-
84
-
85
-
86
-
87
-
88
-
89
-
90
-
91
-
92
-
93
-
94
-
95
-
96
-
97
-
98
-
99
-
100
-
101
-
102
-
103
-
104
-
105
-
106
-
107
-
108
-
109
-
110
-
111
-
112
-
113
-
114
 |
 |

Financial Statements
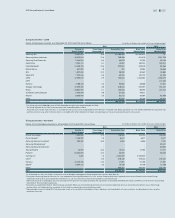
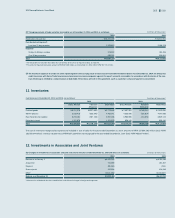
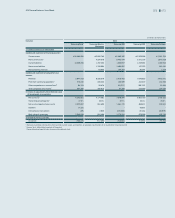
(3) Debt securities
Details of debt securities as at December 31, 2014 and 2013, are as follows: (In millions of Korean won)
2014 2013
Corporate bonds ₩108,275 ₩106,944
Government bonds 272,526 50,356
Bank debentures 2,763,479 899,469
Total ₩3,144,280 ₩1,056,769
Changes in valuation gain (loss) on long-term available-for-sale financial assets for the years ended December 31, 2014 and 2013, are as follows: (In millions of Korean won)
2014 2013
Balance as at January 1 ₩2,845,693 ₩2,572,755
Fair value gain (loss) (134,445)1,264,325
Net (loss) transferred from equity (146,201) (991,387)
Balance as at December 31 2,565,047 2,845,693
Deferred income tax and
non-controlling interests (702,980) (662,359)
Total ₩1,862,067 ₩2,183,334
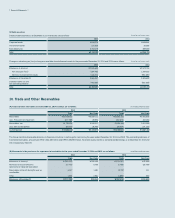
10. Trade and Other Receivables
(A) Trade and other receivables as at December 31, 2014 and 2013, are as follows: (In millions of Korean won)
2014 2013
Trade Non-Trade Trade Non-Trade
Receivables ₩25,008,013 ₩3,559,111 ₩25,292,231 ₩2,931,605
Less: Provisions for impairment (277,788) (9,894) (267,675) (20,046)
Receivables, net 24,730,225 3,549,217 25,024,556 2,911,559
Less: Non-current portion (35,615) (9,342) (36,024) (24,157)
Current portion ₩24,694,610 ₩3,539,875 ₩24,988,532 ₩2,887,402
The Group transferred receivable balances to financial institutions in exchange for cash during the years ended December 31, 2014 and 2013. The outstanding balances of
transferred receivables, amounting to KRW 4,661,384 million and KRW 3,256,935 million, have been accounted for as collateralized borrowings as at December 31, 2014 and
2013, respectively (Note 15).
(B) Movements in the provisions for impairment of receivables for the years ended December 31, 2014 and 2013, are as follows: (In millions of Korean won)
2014 2013
Trade Non-Trade Trade Non-Trade
Balance as at January 1 ₩(267,675)₩(20,046)₩(276,787)₩(2,595)
Reversals of unused amounts /
(provisions for impaired receivables)
(17,475)5,700 (2,785) (18,794)
Receivables written off during the year as
uncollectible
6,017 1,491 13,787 511
Other 1,345 2,961 (1,890)832
Balance as at December 31 ₩(277,788)₩(9,894)₩(267,675)₩(20,046)