Samsung 2014 Annual Report Download - page 92
Download and view the complete annual report
Please find page 92 of the 2014 Samsung annual report below. You can navigate through the pages in the report by either clicking on the pages listed below, or by using the keyword search tool below to find specific information within the annual report.-
 1
1 -
2
-
3
-
4
-
5
-
6
-
7
-
8
-
9
-
10
-
11
-
12
-
13
-
14
-
15
-
16
-
17
-
18
-
19
-
20
-
21
-
22
-
23
-
24
-
25
-
26
-
27
-
28
-
29
-
30
-
31
-
32
-
33
-
34
-
35
-
36
-
37
-
38
-
39
-
40
-
41
-
42
-
43
-
44
-
45
-
46
-
47
-
48
-
49
-
50
-
51
-
52
-
53
-
54
-
55
-
56
-
57
-
58
-
59
-
60
-
61
-
62
-
63
-
64
-
65
-
66
-
67
-
68
-
69
-
70
-
71
-
72
-
73
-
74
-
75
-
76
-
77
-
78
-
79
-
80
-
81
-
 82
82 -
 83
83 -
 84
84 -
 85
85 -
 86
86 -
 87
87 -
 88
88 -
 89
89 -
 90
90 -
 91
91 -
 92
92 -
 93
93 -
 94
94 -
 95
95 -
 96
96 -
 97
97 -
 98
98 -
 99
99 -
 100
100 -
 101
101 -
 102
102 -
103
-
104
-
105
-
106
-
107
-
108
-
109
-
110
-
111
-
112
-
113
-
114
 |
 |

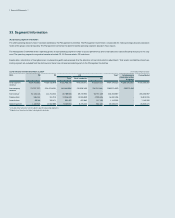
Financial Statements
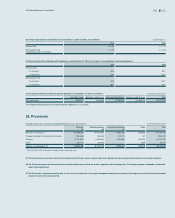
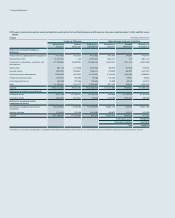
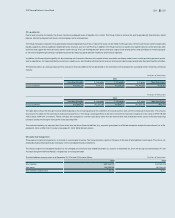
(D) The liquidity analysis of deferred tax assets and deferred tax liabilities is as follows: (In millions of Korean won)
2014 2013
Deferred tax asset (liability) to be recovered
within 12 months
₩1,564,682 ₩(107,699)
Deferred tax liability to be recovered after more
than 12 months (1,135,898) (1,282,892)
Total ₩428,784 ₩(1,390,591)
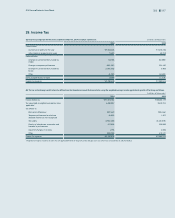
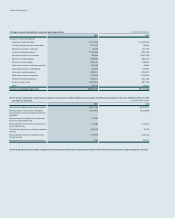
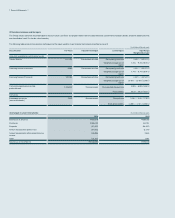
30. Earnings per Share
(A) Basic earnings per share
Basic earnings per share for the years ended December 31, 2014 and 2013, are calculated as follows:
(1) Common stock (In millions of Korean won, except per share data, and thousands of number of shares)
2014 2013
Profit attributable to owners of the Parent
company
₩23,082,499 ₩29,821,215
Profit available for common stock 20,045,198 25,893,396
Weighted-average number of common shares
outstanding
130,924 130,880
Basic earnings per share ₩153,105 ₩197,841
(2) Preferred stock (In millions of Korean won, except per share data, and thousands of number of shares)
2014 2013
Profit attributable to owners of the Parent
company
₩23,082,499 ₩29,821,215
Profit available for common stock 3,037,301 3,927,819
Weighted-average number of preferred shares
outstanding
19,849 19,854
Basic earnings per preferred share ₩153,020 ₩197,838
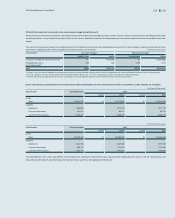
(B) Diluted earnings per share
The Group has one category of potentially dilutive ordinary shares: stock options. Dilutive earnings per share is calculated by adjusting the weighted average number of ordinary
shares outstanding to assume conversion of all dilutive potential ordinary shares.
Diluted earnings per share for the years ended December 31, 2014 and 2013, is calculated as follows:
(1) Common stock (In millions of Korean won, except per share data, and thousands of number of shares)
2014 2013
Profit available for common stock and common
stock equivalents
₩20,045,299 ₩25,894,151
Weighted-average number of shares of
common stock and dilutive potential
common stock
130,933 130,911
Diluted earnings per share ₩153,096 ₩197,800