PG&E 2007 Annual Report Download - page 98
Download and view the complete annual report
Please find page 98 of the 2007 PG&E annual report below. You can navigate through the pages in the report by either clicking on the pages listed below, or by using the keyword search tool below to find specific information within the annual report.-
 1
1 -
2
-
3
-
4
-
5
-
6
-
7
-
8
-
9
-
10
-
11
-
12
-
13
-
14
-
15
-
16
-
17
-
18
-
19
-
20
-
21
-
22
-
23
-
24
-
25
-
26
-
27
-
28
-
29
-
30
-
31
-
32
-
33
-
34
-
35
-
36
-
37
-
38
-
39
-
40
-
41
-
42
-
43
-
44
-
45
-
46
-
47
-
48
-
49
-
50
-
51
-
52
-
53
-
54
-
55
-
56
-
57
-
58
-
59
-
60
-
61
-
62
-
63
-
64
-
65
-
66
-
67
-
68
-
69
-
70
-
71
-
72
-
73
-
74
-
75
-
76
-
77
-
78
-
79
-
80
-
81
-
82
-
83
-
84
-
85
-
86
-
87
-
 88
88 -
 89
89 -
 90
90 -
 91
91 -
 92
92 -
 93
93 -
 94
94 -
 95
95 -
 96
96 -
 97
97 -
 98
98 -
 99
99 -
 100
100 -
 101
101 -
 102
102 -
 103
103 -
 104
104 -
 105
105 -
 106
106 -
 107
107 -
 108
108 -
109
-
110
-
111
-
112
-
113
-
114
-
115
-
116
-
117
-
118
-
119
-
120
-
121
-
122
-
123
-
124
-
125
-
126
-
127
-
128
-
129
-
130
-
131
-
132
-
133
-
134
-
135
-
136
-
137
-
138
-
139
-
140
-
141
-
142
-
143
-
144
-
145
-
146
-
147
-
148
 |
 |

96
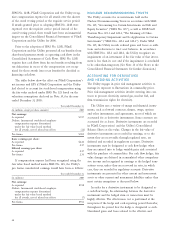
The carrying amount and fair value of PG&E Corporation’s and the Utility’s fi nancial instruments are as follows
(the table below excludes fi nancial instruments with fair values that approximate their carrying values, as these instruments
are presented at their carrying value in the Consolidated Balance Sheets):
At December 31,
2007 2006
Carrying Fair Carrying Fair
(in millions) Amount Value Amount Value
Debt (Note 4):
PG&E Corporation $ 280 $ 849 $ 280 $ 937
Utility 6,823 6,701 5,629 5,616
Rate reduction bonds (Note 5)(1) — — 290 292
Energy recovery bonds (Note 6) 1,936 1,928 2,276 2,239
(1) Rate Reduction Bonds matured on December 26, 2007. (See “Note 5: Rate Reduction Bonds” below.)
GAINS AND LOSSES ON DEBT EXTINGUISHMENTS
Gains and losses on debt extinguishments associated with regulated operations that are subject to the provisions of SFAS
No. 71 are deferred and amortized over the remaining original amortization period of the debt reacquired, consistent
with recovery of costs through regulated rates. Unamortized loss on debt extinguishments, net of gain, was approximately
$269 million and $295 million at December 31, 2007 and 2006, respectively. The Utility’s amortization expense related to
this loss was approximately $26 million in 2007, $27 million in 2006, and $32 million in 2005. Deferred gains and losses
on debt extinguishments are recorded to Other Noncurrent Assets — Regulatory Assets in the Consolidated Balance Sheets.
Gains and losses on debt extinguishments associated with unregulated operations are fully recognized at the time such
debt is reacquired and are reported as a component of interest expense.
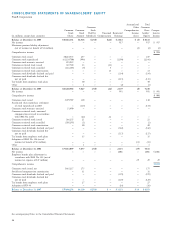
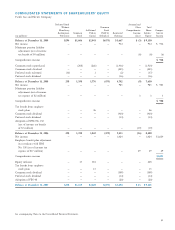
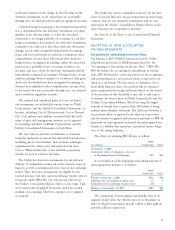
ACCUMULATED OTHER COMPREHENSIVE INCOME (LOSS)
Accumulated other comprehensive income (loss) reports a measure for accumulated changes in equity of an enterprise that
result from transactions and other economic events, other than transactions with shareholders. The following table sets forth
the after-tax changes in each component of accumulated other comprehensive income (loss):
Hedging Minimum Employee Benefi t Accumulated
Transactions in Pension Plan Adjustment in Other
Accordance with Liability Adoption of Accordance with Comprehensive
(in millions) SFAS No. 133 Adjustment SFAS No. 158 SFAS No. 158 Other Income (Loss)
Balance at December 31, 2004 $(1) $(4) $ — $ — $ 1 $ (4)
Period change in:
Minimum pension liability adjustment
(net of income tax benefi t of $3 million) — (4) — — — (4)
Other 1 — — — (1) —
Balance at December 31, 2005 — (8) — — — (8)
Period change in:
Adoption of SFAS No. 158 (net of
income tax benefi t of $8 million) — 8 (19) — — (11)
Balance at December 31, 2006 — — (19) — — (19)
Period change in pension benefi ts and
other benefi ts:
Unrecognized prior service cost (net of
income tax expense of $18 million) — — — 26 — 26
Unrecognized net gain (net of income tax
expense of $195 million) — — — 289 — 289
Unrecognized net transition obligation
(net of income tax expense of $11 million) — — — 16 — 16
Transfer to regulatory account (net of
income tax benefi t of $207 million)(1) — — — (302) — (302)
Balance at December 31, 2007 $ — $ — $(19) $ 29 $ — $ 10
(1) The Utility recorded approximately $109 million in 2007 and $574 million in 2006, pre-tax, as a reduction to the existing pension regulatory liability in
accordance with the provisions of SFAS No. 71. The Utility recorded approximately $44 million, pre-tax, as an addition to the existing pension regulatory
liability in accordance with SFAS No. 71.