PG&E 2007 Annual Report Download - page 129
Download and view the complete annual report
Please find page 129 of the 2007 PG&E annual report below. You can navigate through the pages in the report by either clicking on the pages listed below, or by using the keyword search tool below to find specific information within the annual report.-
 1
1 -
2
-
3
-
4
-
5
-
6
-
7
-
8
-
9
-
10
-
11
-
12
-
13
-
14
-
15
-
16
-
17
-
18
-
19
-
20
-
21
-
22
-
23
-
24
-
25
-
26
-
27
-
28
-
29
-
30
-
31
-
32
-
33
-
34
-
35
-
36
-
37
-
38
-
39
-
40
-
41
-
42
-
43
-
44
-
45
-
46
-
47
-
48
-
49
-
50
-
51
-
52
-
53
-
54
-
55
-
56
-
57
-
58
-
59
-
60
-
61
-
62
-
63
-
64
-
65
-
66
-
67
-
68
-
69
-
70
-
71
-
72
-
73
-
74
-
75
-
76
-
77
-
78
-
79
-
80
-
81
-
82
-
83
-
84
-
85
-
86
-
87
-
88
-
89
-
90
-
91
-
92
-
93
-
94
-
95
-
96
-
97
-
98
-
99
-
100
-
101
-
102
-
103
-
104
-
105
-
106
-
107
-
108
-
109
-
110
-
111
-
112
-
113
-
114
-
115
-
116
-
117
-
118
-
 119
119 -
 120
120 -
 121
121 -
 122
122 -
 123
123 -
 124
124 -
 125
125 -
 126
126 -
 127
127 -
 128
128 -
 129
129 -
 130
130 -
 131
131 -
 132
132 -
 133
133 -
 134
134 -
 135
135 -
 136
136 -
 137
137 -
 138
138 -
 139
139 -
140
-
141
-
142
-
143
-
144
-
145
-
146
-
147
-
148
 |
 |

127
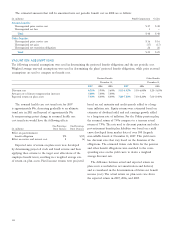
The tax benefi t from restricted stock which vested during
2007 and 2006 totaled $7 million and $4 million, respec-
tively, of which approximately $5 million and $2 million was
recorded by the Utility.
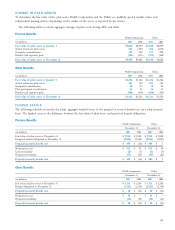
The following table summarizes restricted stock activity
for PG&E Corporation and the Utility for 2007:
Number of Weighted
Shares of Average
Restricted Grant-Date
Stock Fair Value
Nonvested at January 1 1,377,538 $ 29.27
Granted 607,459 $ 45.82
Vested (655,978) $ 23.19
Forfeited (67,894) $ 39.67
Nonvested at December 31 1,261,125 $39.84
The following table summarizes restricted stock activity
for the Utility for 2007:
Number of Weighted
Shares of Average
Restricted Grant-Date
Stock Fair Value
Nonvested at January 1 932,728 $ 29.33
Granted 428,960 $ 45.82
Vested (446,032) $ 23.30
Forfeited (60,244) $ 39.69
Nonvested at December 31 855,412 $39.97
As of December 31, 2007, there was approximately
$20 million of total unrecognized compensation cost relat-
ing to restricted stock, of which $15 million related to the
Utility. The cost is expected to be recognized over a weighted
average period of 1.4 years by PG&E Corporation and
the Utility.
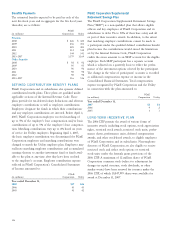
Performance Shares
During 2007, PG&E Corporation awarded 470,225 perfor-
mance shares to eligible participants of PG&E Corporation
and its subsidiaries, of which 320,495 shares were awarded
to the Utility’s eligible participants. Performance shares are
hypothetical shares of PG&E Corporation common stock
that vest at the end of a three-year period and are settled in
cash. Upon vesting, the amount of cash that recipients are
entitled to receive is based on the average closing price of
PG&E Corporation stock for the last 30 calendar days
of the year preceding the vesting date. A payout percentage
is also taken into account, ranging from 0% to 200%,
as measured by PG&E Corporation’s TSR, relative to its
comparator group, for the applicable three-year period.
During 2007, PG&E Corporation paid $18.7 million to
performance share recipients, of which $12.7 million
related to Utility employees.
As of December 31, 2007, $21 million was accrued as
the performance share liability for PG&E Corporation,
of which $14.7 million related to the Utility. The number of
performance shares that were outstanding at December 31,
2007 was 1,203,205, of which 853,868 was related to Utility
employees. Outstanding performance shares are classifi ed as a
liability on the Consolidated Financial Statements of PG&E
Corporation and the Utility because the performance shares
can only be settled in cash upon satisfaction of the perfor-
mance criteria. The liability related to the performance shares
is marked to market at the end of each reporting period
to refl ect the market price of PG&E Corporation common
stock and the payout percentage at the end of the reporting
period. Accordingly, compensation expense recognized for
performance shares will fl uctuate with PG&E Corporation’s
common stock price and its performance relative to its
comparator group.
NOTE 15: RESOLUTION OF
REMAINING CHAPTER 11
DISPUTED CLAIMS
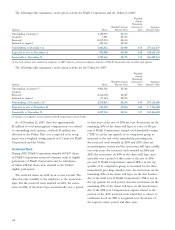
In connection with the Utility’s reorganization under
Chapter 11 of the U.S. Bankruptcy Code on April 12, 2004,
the Utility deposited approximately $1.7 billion into escrow
for the payment of certain Disputed Claims that had been
made by generators and power suppliers for transactions that
occurred during the 2000–2001 California energy crisis. The
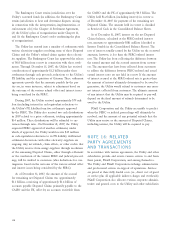
Disputed Claims are being addressed in various FERC and
judicial proceedings seeking refunds on behalf of California
electricity purchasers (including the State of California and
the Utility) from electricity suppliers, including municipal
and governmental entities, for overcharges incurred in the
CAISO and the Power Exchange (“PX”) wholesale electric-
ity markets between May 2000 and June 2001. Many issues
raised in these proceedings, including the extent of the
FERC’s refund authority, and the amount of potential
refunds after taking into account certain costs incurred by
the electricity suppliers have not been resolved. It is uncer-
tain when these proceedings will be concluded.