PG&E 2007 Annual Report Download - page 54
Download and view the complete annual report
Please find page 54 of the 2007 PG&E annual report below. You can navigate through the pages in the report by either clicking on the pages listed below, or by using the keyword search tool below to find specific information within the annual report.
52
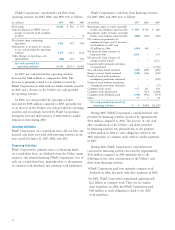
PG&E Corporations’ consolidated cash fl ows from
operating activities for 2007, 2006, and 2005 were as follows:
(in millions) 2007 2006 2005
Net income $1,006 $ 991 $ 917
Gain on disposal of NEGT (net of
income tax benefi t of $13 million
in 2005) — — 13
Net income from continuing
operations 1,006 991 904
Adjustments to reconcile net income
to net cash provided by operating
activities 2,141 1,611 1,122
Other changes in operating assets
and liabilities (601) 112 383
Net cash provided by
operating activities $2,546 $2,714 $2,409
In 2007, net cash provided by operating activities
decreased by $168 million as compared to 2006. The
decrease is primarily related to tax refunds received by
PG&E Corporation in 2006 with no similar refunds received
in 2007 and a decrease in the Utility’s net cash provided
by operating activities.
In 2006, net cash provided by operating activities
increased by $305 million compared to 2005, primarily due
to an increase in the Utility’s net cash provided by operating
activities and tax refunds received by PG&E Corporation
during the fi rst and third quarters of 2006 with no similar
refunds received during 2005.
Investing Activities
PG&E Corporation, on a stand-alone basis, did not have any
material cash fl ows associated with investing activities in the
years ended December 31, 2007, 2006, and 2005.
Financing Activities
PG&E Corporation’s primary sources of fi nancing funds,
on a stand-alone basis, are dividends from the Utility, equity
issuances, and external fi nancing. PG&E Corporation’s uses of
cash, on a stand-alone basis, primarily relate to the payment
of common stock dividends and common stock repurchases.
PG&E Corporation’s cash fl ows from fi nancing activities
for 2007, 2006, and 2005 were as follows:
(in millions) 2007 2006 2005
Borrowings under accounts receivable
facility and working capital facility $ 850 $ 350 $ 260
Repayments under accounts receivable
facility and working capital facility (900) (310) (300)
Net issuance (repayments) of
commercial paper, net of discount
of $1 million in 2007 and
$2 million in 2006 (209) 458 —
Net proceeds from issuance of
long-term debt 1,184 — 451
Net proceeds from issuance of
energy recovery bonds — — 2,711
Long-term debt matured, redeemed,
or repurchased — — (1,556)
Rate reduction bonds matured (290) (290) (290)
Energy recovery bonds matured (340) (316) (140)
Preferred stock with mandatory
redemption provisions redeemed — — (122)
Preferred stock without mandatory
redemption provisions redeemed — — (37)
Common stock issued 175 131 243
Common stock repurchased — (114) (2,188)
Common stock dividends paid (496) (456) (334)
Other 35 3 32
Net cash provided by (used in)
fi nancing activities $ 9 $(544) $(1,270)
During 2007, PG&E Corporation’s consolidated net cash
provided by fi nancing activities increased by approximately
$553 million compared to 2006. The decrease in cash used
after consideration of the Utility’s cash fl ows provided
by fi nancing activities was primarily due to the payment
of $114 million in 2006 to settle obligations related to the
2005 repurchase of common stock, with no similar payments
in 2007.
During 2006, PG&E Corporation’s consolidated net
cash used in fi nancing activities decreased by approximately
$726 million compared to 2005 primarily due to the
following factors, after consideration of the Utility’s cash
fl ows from fi nancing activities:
• PG&E Corporation paid four quarterly common stock
dividends in 2006, but made only three payments in 2005.
• In 2005, PG&E Corporation repurchased approximately
$2.2 billion in common stock. There was no similar
share repurchase in 2006, but PG&E Corporation paid
$114 million to settle obligations related to the 2005
stock repurchase.


