PG&E 2007 Annual Report Download - page 127
Download and view the complete annual report
Please find page 127 of the 2007 PG&E annual report below. You can navigate through the pages in the report by either clicking on the pages listed below, or by using the keyword search tool below to find specific information within the annual report.-
 1
1 -
2
-
3
-
4
-
5
-
6
-
7
-
8
-
9
-
10
-
11
-
12
-
13
-
14
-
15
-
16
-
17
-
18
-
19
-
20
-
21
-
22
-
23
-
24
-
25
-
26
-
27
-
28
-
29
-
30
-
31
-
32
-
33
-
34
-
35
-
36
-
37
-
38
-
39
-
40
-
41
-
42
-
43
-
44
-
45
-
46
-
47
-
48
-
49
-
50
-
51
-
52
-
53
-
54
-
55
-
56
-
57
-
58
-
59
-
60
-
61
-
62
-
63
-
64
-
65
-
66
-
67
-
68
-
69
-
70
-
71
-
72
-
73
-
74
-
75
-
76
-
77
-
78
-
79
-
80
-
81
-
82
-
83
-
84
-
85
-
86
-
87
-
88
-
89
-
90
-
91
-
92
-
93
-
94
-
95
-
96
-
97
-
98
-
99
-
100
-
101
-
102
-
103
-
104
-
105
-
106
-
107
-
108
-
109
-
110
-
111
-
112
-
113
-
114
-
115
-
116
-
 117
117 -
 118
118 -
 119
119 -
 120
120 -
 121
121 -
 122
122 -
 123
123 -
 124
124 -
 125
125 -
 126
126 -
 127
127 -
 128
128 -
 129
129 -
 130
130 -
 131
131 -
 132
132 -
 133
133 -
 134
134 -
 135
135 -
 136
136 -
 137
137 -
138
-
139
-
140
-
141
-
142
-
143
-
144
-
145
-
146
-
147
-
148
 |
 |

125
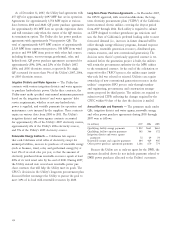
Awards made under the PG&E Corporation Long-Term
Incentive Program before December 31, 2005 and still out-
standing continue to be governed by the terms and conditions
of the PG&E Corporation Long-Term Incentive Program.
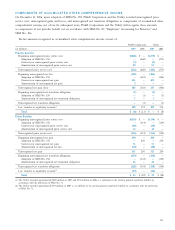
PG&E Corporation and the Utility use an estimated
annual forfeiture rate of 2%, based on historic forfeiture
rates, for purposes of determining compensation expense
for share-based incentive awards. The following table pro-
vides a summary of total compensation expense for PG&E
Corporation and the Utility for share-based incentive awards
for the year ended December 31, 2007:
Year ended December 31, 2007
PG&E
(in millions) Corporation Utility
Stock Options $ 7 $ 4
Restricted Stock 24 15
Performance Shares (8) (7)
Total Compensation Expense (pre-tax) $23 $12
Total Compensation Expense (after-tax) $14 $ 7
Year ended December 31, 2006
PG&E
(in millions) Corporation Utility
Stock Options $12 $ 8
Restricted Stock 20 14
Performance Shares 33 24
Total Compensation Expense (pre-tax) $65 $46
Total Compensation Expense (after-tax) $39 $27
Stock Options
Other than the grant of options to purchase 7,285 shares of
PG&E Corporation common stock to non-employee direc-
tors of PG&E Corporation in accordance with the formula
and nondiscretionary provisions of the 2006 LTIP, no other
stock options were granted during 2007. The exercise price
of stock options granted under the 2006 LTIP and all other
outstanding stock options is equal to the market price of
PG&E Corporation’s common stock on the date of grant.
Stock options generally have a ten-year term and vest over
four years of continuous service, subject to accelerated
vesting in certain circumstances.
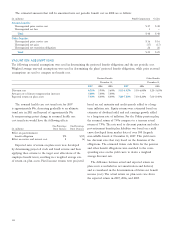
The fair value of each stock option on the date of grant
is estimated using the Black-Scholes valuation method. The
weighted average grant date fair value of options granted
using the Black-Scholes valuation method was $7.81, $6.98,
and $10.08 per share in 2007, 2006, and 2005, respectively.
The signifi cant assumptions used for shares granted in 2007,
2006, and 2005 were:
2007 2006 2005
Expected stock price
volatility 16.5% 22.1% 40.6%
Expected annual dividend
payment $1.44 $1.32 $1.20
Risk-free interest rate 4.73% 4.46% 3.74%
Expected life 5.4 years 5.6 years 5.9 years
Expected volatilities are based on historical volatility of
PG&E Corporation’s common stock. The expected dividend
payment is the dividend yield at the date of grant. The
risk-free interest rate for periods within the contractual term
of the stock option is based on the U.S. Treasury rates in
effect at the date of grant. The expected life of stock options
is derived from historical data that estimates stock option
exercises and employee departure behavior.
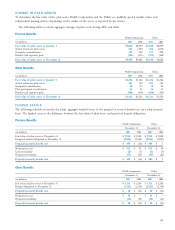
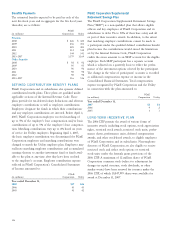
The following table summarizes total intrinsic value (fair
market value of PG&E Corporation’s stock less stock option
strike price) of options exercised for PG&E Corporation and
the Utility in 2007, 2006, and 2005:
PG&E
(in millions) Corporation Utility
2007:
Intrinsic value of options exercised $ 59 $34
2006:
Intrinsic value of options exercised $ 97 $51
2005:
Intrinsic value of options exercised $125 $57
The tax benefi t from stock options exercised totaled $20 mil-
lion and $31 million for the year ended December 31, 2007
and December 31, 2006, respectively, of which approximately
$11 million and $44 million was recorded by the Utility.