PG&E 2007 Annual Report Download - page 44
Download and view the complete annual report
Please find page 44 of the 2007 PG&E annual report below. You can navigate through the pages in the report by either clicking on the pages listed below, or by using the keyword search tool below to find specific information within the annual report.-
 1
1 -
2
-
3
-
4
-
5
-
6
-
7
-
8
-
9
-
10
-
11
-
12
-
13
-
14
-
15
-
16
-
17
-
18
-
19
-
20
-
21
-
22
-
23
-
24
-
25
-
26
-
27
-
28
-
29
-
30
-
31
-
32
-
33
-
 34
34 -
 35
35 -
 36
36 -
 37
37 -
 38
38 -
 39
39 -
 40
40 -
 41
41 -
 42
42 -
 43
43 -
 44
44 -
 45
45 -
 46
46 -
 47
47 -
 48
48 -
 49
49 -
 50
50 -
 51
51 -
 52
52 -
 53
53 -
 54
54 -
55
-
56
-
57
-
58
-
59
-
60
-
61
-
62
-
63
-
64
-
65
-
66
-
67
-
68
-
69
-
70
-
71
-
72
-
73
-
74
-
75
-
76
-
77
-
78
-
79
-
80
-
81
-
82
-
83
-
84
-
85
-
86
-
87
-
88
-
89
-
90
-
91
-
92
-
93
-
94
-
95
-
96
-
97
-
98
-
99
-
100
-
101
-
102
-
103
-
104
-
105
-
106
-
107
-
108
-
109
-
110
-
111
-
112
-
113
-
114
-
115
-
116
-
117
-
118
-
119
-
120
-
121
-
122
-
123
-
124
-
125
-
126
-
127
-
128
-
129
-
130
-
131
-
132
-
133
-
134
-
135
-
136
-
137
-
138
-
139
-
140
-
141
-
142
-
143
-
144
-
145
-
146
-
147
-
148
 |
 |

42
Cost of Electricity
The Utility’s cost of electricity includes electricity purchase
costs, hedging costs, and the cost of fuel used by its genera-
tion facilities or supplied to other facilities under tolling
agreements. It excludes costs associated with the Utility’s
own generation facilities, which are included in Operating
and Maintenance expense in the Consolidated Statements of
Income. The Utility’s cost of purchased power and the cost
of fuel used in Utility-owned generation are passed through
to customers.
The Utility is required to dispatch, or schedule, all of the
electricity resources within its portfolio in the most cost-
effective way. This requirement, in certain cases, requires the
Utility to schedule more electricity than is necessary to meet
its load and therefore to sell this excess electricity on the
open market. The Utility typically schedules excess electricity
when the expected sales proceeds exceed the variable costs
to operate a generation facility or buy electricity under
an optional contract. The Utility’s net proceeds from the
sale of surplus electricity are recorded as a reduction to
the cost of electricity.
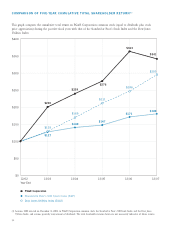
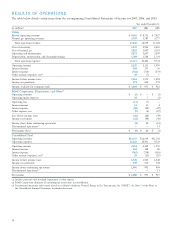
The following table provides a summary of the Utility’s
cost of electricity and the total amount and average cost of
purchased power:
(in millions) 2007 2006 2005
Cost of purchased power(1) $ 3,443 $ 3,114 $ 2,706
Proceeds from surplus sales
allocated to the Utility (155) (343) (478)
Fuel used in own generation 149 151 182
Total cost of electricity $ 3,437 $ 2,922 $ 2,410
Average cost of purchased power
per kWh $ 0.089 $ 0.084 $ 0.079
Total purchased power
(in millions of kWh) 38,828 36,913 34,203
(1) Includes costs associated with RMR agreements.
The Utility’s total cost of electricity increased by approxi-
mately $515 million, or 18%, in 2007 compared to 2006.
This increase was primarily driven by a 6% increase in the
average cost of purchased power. The average cost of pur-
chased power increased $0.005 per kilowatt-hour (“kWh”)
from 2006 to 2007 primarily due to higher energy payments
made to qualifying facilities (“QFs”) after their fi ve-year
fi xed price contracts expired during the summer of 2006. In
addition, the Utility increased the volume of its third-party
power purchases primarily due to a reduction in the avail-
ability of lower-cost hydroelectric power resulting from less
than average precipitation during 2007 as compared to 2006.
These increases were partially offset by a decrease in costs
associated with RMR agreements.
The Utility’s cost of electricity increased by approximately
$512 million, or 21%, in 2006 compared to 2005, mainly
due to an increase in total purchased power of 2,710 million
kWh, or 8%, and an increase in the average cost of pur-
chased power of $0.005 per kWh, or 6%, in 2006, compared
to 2005. This was primarily caused by an increase in volume
of purchased power due to greater customer demand during
unseasonably warm weather during the summer of 2006
and a decrease in the volume of electricity provided by the
DWR to the Utility’s customers. Additionally, the Utility’s
service to customers who purchase “bundled” services
(i.e., generation, transmission, and distribution) grew, further
increasing volume.
The Utility’s cost of electricity in 2008 and future years
will depend upon electricity and natural gas prices, the level
of hydroelectric and nuclear power that the Utility produces,
the cost of procuring more renewable energy, impacts from
termination of DWR contracts, CPUC-ordered changes to
QF pricing, and changes in customer demand. (See the
“Risk Management Activities — Price Risk” below.)
The Utility’s future cost of electricity also may be
affected by federal or state legislation or rules which may
be adopted to regulate the emissions of greenhouse gases
from the Utility’s electricity generating facilities or the gen-
erating facilities from which the Utility procures electricity.
As directed by recent California legislation, the CPUC has
already adopted an interim greenhouse gas emissions perfor-
mance standard that would apply to electricity procured or
generated by the Utility. (See “Risk Factors” below.)
Natural Gas Operating Revenues
The Utility sells natural gas and natural gas transportation
services. The Utility’s transportation services are provided
by a transmission system and a distribution system. The
transmission system transports gas throughout California for
delivery to the Utility’s distribution system which, in turn,
delivers natural gas to end-use customers. The transmission
system also delivers natural gas to large end-use customers
who are connected directly to the transmission system.
In addition, the Utility delivers natural gas to off-system
markets, primarily in southern California, in competition
with interstate pipelines.