PG&E 2007 Annual Report Download - page 46
Download and view the complete annual report
Please find page 46 of the 2007 PG&E annual report below. You can navigate through the pages in the report by either clicking on the pages listed below, or by using the keyword search tool below to find specific information within the annual report.-
 1
1 -
2
-
3
-
4
-
5
-
6
-
7
-
8
-
9
-
10
-
11
-
12
-
13
-
14
-
15
-
16
-
17
-
18
-
19
-
20
-
21
-
22
-
23
-
24
-
25
-
26
-
27
-
28
-
29
-
30
-
31
-
32
-
33
-
34
-
35
-
 36
36 -
 37
37 -
 38
38 -
 39
39 -
 40
40 -
 41
41 -
 42
42 -
 43
43 -
 44
44 -
 45
45 -
 46
46 -
 47
47 -
 48
48 -
 49
49 -
 50
50 -
 51
51 -
 52
52 -
 53
53 -
 54
54 -
 55
55 -
 56
56 -
57
-
58
-
59
-
60
-
61
-
62
-
63
-
64
-
65
-
66
-
67
-
68
-
69
-
70
-
71
-
72
-
73
-
74
-
75
-
76
-
77
-
78
-
79
-
80
-
81
-
82
-
83
-
84
-
85
-
86
-
87
-
88
-
89
-
90
-
91
-
92
-
93
-
94
-
95
-
96
-
97
-
98
-
99
-
100
-
101
-
102
-
103
-
104
-
105
-
106
-
107
-
108
-
109
-
110
-
111
-
112
-
113
-
114
-
115
-
116
-
117
-
118
-
119
-
120
-
121
-
122
-
123
-
124
-
125
-
126
-
127
-
128
-
129
-
130
-
131
-
132
-
133
-
134
-
135
-
136
-
137
-
138
-
139
-
140
-
141
-
142
-
143
-
144
-
145
-
146
-
147
-
148
 |
 |

44
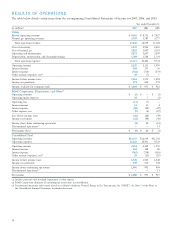
The following table provides a summary of the Utility’s
cost of natural gas:
(in millions) 2007 2006 2005
Cost of natural gas sold $1,859 $1,958 $2,051
Cost of natural gas transportation 176 139 140
Total cost of natural gas $2,035 $2,097 $2,191
Average cost per Mcf of
natural gas sold $ 7.04 $ 7.28 $ 7.57
Total natural gas sold
(in millions of Mcf) 264 269 271
The Utility’s total cost of natural gas decreased by
approximately $62 million, or 3%, in 2007 compared to
2006, primarily due to a decrease in the average market
price of natural gas purchased of approximately $0.24 per
thousand cubic feet (“Mcf”), or 3%. Average market prices
were signifi cantly higher in the beginning of 2006 as dam-
ages to production facilities caused by severe weather reduced
natural gas supply. In addition, the price of natural gas has
declined due to a relatively mild hurricane season in 2007
as compared to industry forecasts, resulting in no material
supply disruptions, and a relatively large amount of natural
gas in storage across the nation.
The Utility’s total cost of natural gas decreased by
approximately $94 million, or 4%, in 2006 compared to
2005, primarily due to a decrease in the average market price
of natural gas purchased of approximately $0.29 per Mcf, or
4%. This decrease was primarily due to signifi cantly higher
than average market prices throughout 2005 as a result of
severe weather conditions and a strong hurricane season as
compared to the same period in 2006.
The Utility’s cost of natural gas in subsequent periods
will be primarily determined by market forces in North
America. Market forces include supply availability, customer
demand, and industry perceptions of risks that may affect
either, such as the possibility of hurricanes in the gas-
producing regions of the Gulf of Mexico or of protracted
heat waves that may increase gas-fi red electric demand from
high air conditioning loads.
Operating and Maintenance
Operating and maintenance expenses consist mainly of the
Utility’s costs to operate and maintain its electricity and
natural gas facilities, customer accounts and service expenses,
public purpose program expenses, and administrative and
general expenses. Generally, these expenses are offset by
corresponding revenues authorized by the CPUC and the
FERC in various proceedings.
The Utility’s operating and maintenance expenses
increased by approximately $175 million, or 5%, in 2007
compared to 2006, mainly due to the following factors:
• Payments for customer assistance and public purpose
programs, such as the California Solar Initiative program
and the Mass Market program, increased by approximately
$99 million primarily due to increased customer participa-
tion in these programs.
• The Utility’s distribution expenses increased by approxi-
mately $40 million primarily due to service costs related to
the creation of new dispatch and scheduling stations and
vegetation management in the Utility’s service territory.
• Billing and collection costs increased by approximately
$33 million.
• Labor costs increased by approximately $33 million
primarily due to higher employee headcount and increased
base salaries and incentives.
• Costs of outside consulting services and contracts primarily
related to information systems increased by approximately
$22 million.
• Approximately $22 million was accrued for missed meal
payments to certain Utility employees covered under
collective bargaining agreements. (See Note 17 “California
Labor Code Issues” of the Notes to the Consolidated
Financial Statements.)
• Workers’ compensation expense increased by approximately
$20 million due to a decrease to the discount rate on the
workers’ compensation obligation and higher than expected
workers’ compensation claims.
• Property taxes increased by approximately $12 million due
to electric plant growth, tax rate increases, and increases in
assessed values in 2007.
• In 2006, the Utility reduced its accrual for long-term
disability benefi ts by approximately $11 million refl ecting
changes in sick leave eligibility rules, but there was no
similar adjustment in 2007.