PG&E 2007 Annual Report Download - page 93
Download and view the complete annual report
Please find page 93 of the 2007 PG&E annual report below. You can navigate through the pages in the report by either clicking on the pages listed below, or by using the keyword search tool below to find specific information within the annual report.-
 1
1 -
2
-
3
-
4
-
5
-
6
-
7
-
8
-
9
-
10
-
11
-
12
-
13
-
14
-
15
-
16
-
17
-
18
-
19
-
20
-
21
-
22
-
23
-
24
-
25
-
26
-
27
-
28
-
29
-
30
-
31
-
32
-
33
-
34
-
35
-
36
-
37
-
38
-
39
-
40
-
41
-
42
-
43
-
44
-
45
-
46
-
47
-
48
-
49
-
50
-
51
-
52
-
53
-
54
-
55
-
56
-
57
-
58
-
59
-
60
-
61
-
62
-
63
-
64
-
65
-
66
-
67
-
68
-
69
-
70
-
71
-
72
-
73
-
74
-
75
-
76
-
77
-
78
-
79
-
80
-
81
-
82
-
 83
83 -
 84
84 -
 85
85 -
 86
86 -
 87
87 -
 88
88 -
 89
89 -
 90
90 -
 91
91 -
 92
92 -
 93
93 -
 94
94 -
 95
95 -
 96
96 -
 97
97 -
 98
98 -
 99
99 -
 100
100 -
 101
101 -
 102
102 -
 103
103 -
104
-
105
-
106
-
107
-
108
-
109
-
110
-
111
-
112
-
113
-
114
-
115
-
116
-
117
-
118
-
119
-
120
-
121
-
122
-
123
-
124
-
125
-
126
-
127
-
128
-
129
-
130
-
131
-
132
-
133
-
134
-
135
-
136
-
137
-
138
-
139
-
140
-
141
-
142
-
143
-
144
-
145
-
146
-
147
-
148
 |
 |

91
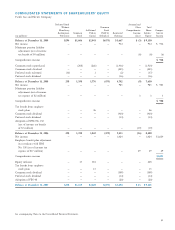
Preferred Stock Accumulated
Without Common Other Total
Mandatory Additional Stock Comprehensive Share- Compre-
Redemption Common Paid-in Held by Reinvested Income holders’ hensive
(in millions) Provisions Stock Capital Subsidiary Earnings (Loss) Equity Income
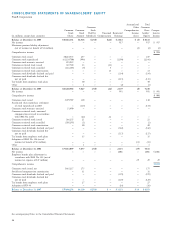
Balance at December 31, 2004 $294 $1,606 $2,041 $(475) $ 5,667 $ (3) $ 9,130
Net income — — — — 934 — 934 $ 934
Minimum pension liability
adjustment (net of income
tax benefi t of $4 million) — — — — — (6) (6) (6)
Comprehensive income $ 928
Common stock repurchased — (208) (266) — (1,436) — (1,910)
Common stock dividend — — — — (445) — (445)
Preferred stock redeemed (36) — 1 — (2) — (37)
Preferred stock dividend — — — — (16) — (16)
Balance at December 31, 2005 258 1,398 1,776 (475) 4,702 (9) 7,650
Net income — — — — 985 — 985 $ 985
Minimum pension liability
adjustment (net of income
tax expense of $2 million) — — — — — 3 3 3
Comprehensive income $ 988
Tax benefi t from employee
stock plans — — 46 — — — 46
Common stock dividend — — — — (460) — (460)
Preferred stock dividend — — — — (14) — (14)
Adoption of SFAS No. 158
(net of income tax benefi t
of $7 million) — — — — — (10) (10)
Balance at December 31, 2006 258 1,398 1,822 (475) 5,213 (16) 8,200
Net income — — — — 1,024 — 1,024 $ 1,024
Employee benefi t plan adjustment
in accordance with SFAS
No. 158 (net of income tax
expense of $17 million) — — — — — 29 29 29
Comprehensive income $1,053
Equity infusion — 17 383 — — — 400
Tax benefi t from employee
stock plans — — 15 — — — 15
Common stock dividend — — — — (509) — (509)
Preferred stock dividend — — — — (14) — (14)
Adoption of FIN 48 — — — — (20) — (20)
Balance at December 31, 2007 $258 $1,415 $2,220 $(475) $ 5,694 $ 13 $ 9,125
CONSOLIDATED STATEMENTS OF SHAREHOLDERS’ EQUITY
Pacifi c Gas and Electric Company
See accompanying Notes to the Consolidated Financial Statements.