PG&E 2007 Annual Report Download - page 138
Download and view the complete annual report
Please find page 138 of the 2007 PG&E annual report below. You can navigate through the pages in the report by either clicking on the pages listed below, or by using the keyword search tool below to find specific information within the annual report.-
 1
1 -
2
-
3
-
4
-
5
-
6
-
7
-
8
-
9
-
10
-
11
-
12
-
13
-
14
-
15
-
16
-
17
-
18
-
19
-
20
-
21
-
22
-
23
-
24
-
25
-
26
-
27
-
28
-
29
-
30
-
31
-
32
-
33
-
34
-
35
-
36
-
37
-
38
-
39
-
40
-
41
-
42
-
43
-
44
-
45
-
46
-
47
-
48
-
49
-
50
-
51
-
52
-
53
-
54
-
55
-
56
-
57
-
58
-
59
-
60
-
61
-
62
-
63
-
64
-
65
-
66
-
67
-
68
-
69
-
70
-
71
-
72
-
73
-
74
-
75
-
76
-
77
-
78
-
79
-
80
-
81
-
82
-
83
-
84
-
85
-
86
-
87
-
88
-
89
-
90
-
91
-
92
-
93
-
94
-
95
-
96
-
97
-
98
-
99
-
100
-
101
-
102
-
103
-
104
-
105
-
106
-
107
-
108
-
109
-
110
-
111
-
112
-
113
-
114
-
115
-
116
-
117
-
118
-
119
-
120
-
121
-
122
-
123
-
124
-
125
-
126
-
127
-
 128
128 -
 129
129 -
 130
130 -
 131
131 -
 132
132 -
 133
133 -
 134
134 -
 135
135 -
 136
136 -
 137
137 -
 138
138 -
 139
139 -
 140
140 -
 141
141 -
 142
142 -
 143
143 -
 144
144 -
 145
145 -
 146
146 -
 147
147 -
 148
148
 |
 |

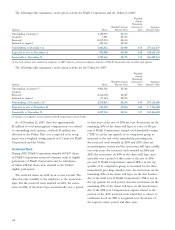
136
Quarter ended
(in millions, except per share amounts) December 31 September 30 June 30 March 31
2007
PG&E Corporation
Operating revenues $3,415 $3,279 $3,187 $3,356
Operating income 448 582 555 529
Income from continuing operations 203 278 269 256
Net income 203 278 269 256
Earnings per common share from continuing operations, basic 0.56 0.77 0.75 0.71
Earnings per common share from continuing operations, diluted 0.56 0.77 0.74 0.71
Net income per common share, basic 0.56 0.77 0.75 0.71
Net income per common share, diluted 0.56 0.77 0.74 0.71
Common stock price per share:
High 48.56 47.87 50.89 47.71
Low 43.09 42.14 43.90 43.87
Utility
Operating revenues $3,416 $3,279 $3,187 $3,356
Operating income 453 585 556 531
Net income 206 283 274 261
Income available for common stock 203 279 270 258
2006
PG&E Corporation
Operating revenues $3,206 $3,168 $3,017 $3,148
Operating income 439 735 465 469
Income from continuing operations 152 393 232 214
Net income 152 393 232 214
Earnings per common share from continuing operations, basic 0.43 1.09 0.65 0.61
Earnings per common share from continuing operations, diluted 0.43 1.09 0.65 0.60
Net income per common share, basic 0.43 1.09 0.65 0.61
Net income per common share, diluted 0.43 1.09 0.65 0.60
Common stock price per share:
High 48.17 42.51 40.90 40.68
Low 40.72 39.06 38.30 36.25
Utility
Operating revenues $3,206 $3,168 $3,017 $3,148
Operating income 443 737 465 470
Net income 159 378 231 217
Income available for common stock 155 375 227 214
QUARTERLY CONSOLIDATED FINANCIAL DATA (UNAUDITED)