PG&E 2007 Annual Report Download - page 52
Download and view the complete annual report
Please find page 52 of the 2007 PG&E annual report below. You can navigate through the pages in the report by either clicking on the pages listed below, or by using the keyword search tool below to find specific information within the annual report.
50
UTILITY
Operating Activities
The Utility’s cash fl ows from operating activities primarily
consist of receipts from customers less payments of operating
expenses, other than expenses such as depreciation that do
not require the use of cash.
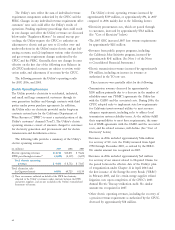
The Utility’s cash fl ows from operating activities for 2007,
2006, and 2005 were as follows:
(in millions) 2007 2006 2005
Net income $1,024 $ 985 $ 934
Adjustments to reconcile net income
to net cash provided by operating
activities 2,122 1,573 1,082
Other changes in operating assets
and liabilities (605) 19 350
Net cash provided by
operating activities $2,541 $2,577 $2,366
Net cash provided by operating activities decreased by
approximately $36 million in 2007 from 2006. The decrease
primarily relates to a decline in cash settlements from energy
suppliers in 2007 as compared to 2006. This decrease was
offset primarily by an increase in net income in 2007 as
compared to 2006.
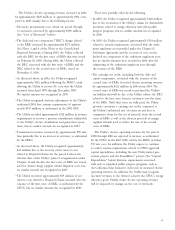
Net cash provided by operating activities increased by
approximately $211 million in 2006 from 2005. In addition
to the increase in net income, net cash provided by operating
activities increased primarily due to the following factors:
• The Utility paid approximately $500 million less in net
tax payments in 2006 as compared to 2005.
• Deferred income taxes and tax credits decreased by
approximately $350 million, primarily due to an increased
California franchise tax deduction, lower taxable supplier
settlement income received and a deduction related to the
payment of previously accrued litigation costs.
• Cash settlements with energy suppliers declined by approxi-
mately $140 million in 2006 as compared to 2005.
These increases were partially offset by the following:
• Approximately $290 million of pension contributions were
made during 2006 but not in 2005.
• Approximately $295 million was paid in April 2006 to
settle the majority of claims relating to alleged exposure to
chromium at the Utility’s natural gas compressor stations.
• The Utility had approximately $125 million in additional
costs primarily related to power and gas procurement that
were unpaid at the end of 2005, compared to the end of
2006, primarily due to higher gas prices during 2005.
Investing Activities
The Utility’s investing activities consist of construction of
new and replacement facilities necessary to deliver safe and
reliable electricity and natural gas services to its customers.
The level of cash used in investing activities depends pri-
marily upon the amount and type of construction activities,
which can be infl uenced by the need to make electricity and
natural gas reliability improvements as well as by storms
and other factors.
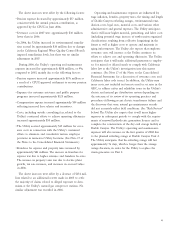
The Utility’s cash fl ows from investing activities for 2007,
2006, and 2005 were as follows:
(in millions) 2007 2006 2005
Capital expenditures $(2,768) $(2,402) $(1,803)
Net proceeds from sale of assets 21 17 39
Decrease in restricted cash 185 115 434
Other investing activities, net (103) (156) (29)
Net cash used in investing
activities $(2,665) $(2,426) $(1,359)
Net cash used in investing activities increased by
approximately $239 million in 2007 compared to 2006,
primarily due to an increase of approximately $370 million
in capital expenditures for the SmartMeter™ installation
project, generation facility spending, replacing and expand-
ing gas and electric distribution systems, and improving
the electric transmission infrastructure. (See “Capital
Expenditures” below.)
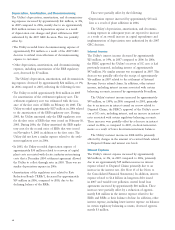
Net cash used in investing activities increased by
approximately $1 billion in 2006 compared to 2005,
primarily due to approximately $600 million of capital
expenditures related to software improvements, the
SmartMeter™ project, generation facilities, the improvement
of the gas and electric distribution system, and the improve-
ment of the electric transmission infrastructure. In addition,
the Utility released $300 million more cash from escrow
in 2005 upon settlement of Disputed Claims than in 2006.


