PG&E 2007 Annual Report Download - page 45
Download and view the complete annual report
Please find page 45 of the 2007 PG&E annual report below. You can navigate through the pages in the report by either clicking on the pages listed below, or by using the keyword search tool below to find specific information within the annual report.-
 1
1 -
2
-
3
-
4
-
5
-
6
-
7
-
8
-
9
-
10
-
11
-
12
-
13
-
14
-
15
-
16
-
17
-
18
-
19
-
20
-
21
-
22
-
23
-
24
-
25
-
26
-
27
-
28
-
29
-
30
-
31
-
32
-
33
-
34
-
 35
35 -
 36
36 -
 37
37 -
 38
38 -
 39
39 -
 40
40 -
 41
41 -
 42
42 -
 43
43 -
 44
44 -
 45
45 -
 46
46 -
 47
47 -
 48
48 -
 49
49 -
 50
50 -
 51
51 -
 52
52 -
 53
53 -
 54
54 -
 55
55 -
56
-
57
-
58
-
59
-
60
-
61
-
62
-
63
-
64
-
65
-
66
-
67
-
68
-
69
-
70
-
71
-
72
-
73
-
74
-
75
-
76
-
77
-
78
-
79
-
80
-
81
-
82
-
83
-
84
-
85
-
86
-
87
-
88
-
89
-
90
-
91
-
92
-
93
-
94
-
95
-
96
-
97
-
98
-
99
-
100
-
101
-
102
-
103
-
104
-
105
-
106
-
107
-
108
-
109
-
110
-
111
-
112
-
113
-
114
-
115
-
116
-
117
-
118
-
119
-
120
-
121
-
122
-
123
-
124
-
125
-
126
-
127
-
128
-
129
-
130
-
131
-
132
-
133
-
134
-
135
-
136
-
137
-
138
-
139
-
140
-
141
-
142
-
143
-
144
-
145
-
146
-
147
-
148
 |
 |

43
The Utility’s natural gas customers consist of two
categories: core and non-core customers. The core customer
class is comprised mainly of residential and smaller com-
mercial customers. The non-core customer class is comprised
of industrial and larger commercial customers. The Utility
provides natural gas transportation services to all core and
non-core customers connected to the Utility’s system in its
service territory. Core customers can purchase natural gas
from either the Utility or alternate energy service providers.
The Utility does not procure natural gas for non-core cus-
tomers. When the Utility provides both transportation and
natural gas supply, the Utility refers to the combined service
as bundled natural gas service. In 2007, core customers
represented over 99% of the Utility’s total customers and
approximately 38% of its total natural gas deliveries, while
non-core customers comprised less than 1% of the Utility’s
total customers and approximately 62% of its total natural
gas deliveries. As discussed above, because the Utility sells
most of its transportation services under volumetric rates,
the Utility is exposed to volumetric revenue risk.
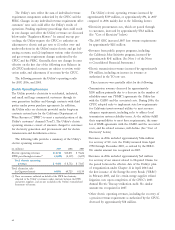
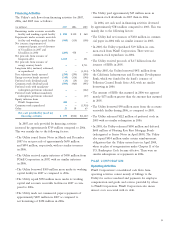
The following table provides a summary of the Utility’s
natural gas operating revenues:
(in millions) 2007 2006 2005
Bundled natural gas revenues $3,417 $3,472 $3,539
Transportation service-only revenues 340 315 238
Total natural gas operating
revenues $3,757 $3,787 $3,777
Average bundled revenue per
Mcf of natural gas sold $12.93 $12.89 $13.05
Total bundled natural gas sales
(in millions of Mcf) 264 269 271
The Utility’s natural gas operating revenues decreased by
approximately $30 million, or less than one percent, in 2007
compared to 2006. This was primarily due to a decrease in
bundled natural gas revenues of approximately $55 million,
or 2%, as a result of decreases in the cost of natural gas,
which are passed through to customers. This decrease was
partially offset by the increased base revenue requirements
authorized in the 2007 GRC and an increase in revenue
requirements relating to the SmartMeter™ project.
The Utility’s natural gas operating revenues increased by
approximately $10 million, or less than one percent, in 2006
compared to 2005. The increase in natural gas operating
revenues was primarily due to the following factors:
• The Utility recorded approximately $43 million in revenue
requirements for a pension contribution attributable to the
Utility’s natural gas distribution operations, but no similar
amount was recorded in 2005.
• Attrition adjustments to the Utility’s 2003 GRC authorized
revenue requirements and revenues authorized in the
2006 cost of capital proceeding contributed approximately
$22 million.
• Miscellaneous natural gas revenues increased by approxi-
mately $26 million.
• Transportation service-only revenues increased by approxi-
mately $77 million, or 32%, as a result of an increase
in volume and a slight increase in rates as authorized by
the CPUC.
These increases were partially offset by the following:
• The cost of natural gas, which is passed through to cus-
tomers, decreased by approximately $132 million.
• In 2005, the Utility recognized approximately $26 million
due to the resolution of the Utility’s claims for shareholder
incentives related to energy effi ciency and other public
purpose programs, but no similar amount was recorded
in 2006.
Future natural gas operating revenues will be impacted
by changes in the cost of natural gas, the Utility’s gas trans-
portation rates, natural gas throughput volume, and other
factors. For 2008 through 2010, the Gas Accord IV settle-
ment agreement provides for an overall modest increase
in the revenue requirements and rates for the Utility’s gas
transmission and storage services. In addition, the Utility’s
natural gas operating revenues for distribution are expected
to increase through 2010 as a result of revenue requirement
increases authorized by the CPUC in the 2007 GRC. Finally,
the Utility may recognize incentive revenues to the extent it
achieves the CPUC’s energy effi ciency goals.
Cost of Natural Gas
The Utility’s cost of natural gas includes the purchase
costs of natural gas and transportation costs on interstate
pipelines and intrastate pipelines, but excludes the trans-
portation costs for non-core customers, which are included
in Operating and Maintenance expense in the Consolidated
Statements of Income.