PG&E 2007 Annual Report Download - page 92
Download and view the complete annual report
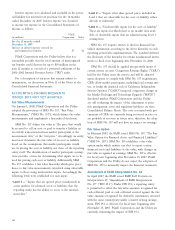
Please find page 92 of the 2007 PG&E annual report below. You can navigate through the pages in the report by either clicking on the pages listed below, or by using the keyword search tool below to find specific information within the annual report.-
 1
1 -
2
-
3
-
4
-
5
-
6
-
7
-
8
-
9
-
10
-
11
-
12
-
13
-
14
-
15
-
16
-
17
-
18
-
19
-
20
-
21
-
22
-
23
-
24
-
25
-
26
-
27
-
28
-
29
-
30
-
31
-
32
-
33
-
34
-
35
-
36
-
37
-
38
-
39
-
40
-
41
-
42
-
43
-
44
-
45
-
46
-
47
-
48
-
49
-
50
-
51
-
52
-
53
-
54
-
55
-
56
-
57
-
58
-
59
-
60
-
61
-
62
-
63
-
64
-
65
-
66
-
67
-
68
-
69
-
70
-
71
-
72
-
73
-
74
-
75
-
76
-
77
-
78
-
79
-
80
-
81
-
 82
82 -
 83
83 -
 84
84 -
 85
85 -
 86
86 -
 87
87 -
 88
88 -
 89
89 -
 90
90 -
 91
91 -
 92
92 -
 93
93 -
 94
94 -
 95
95 -
 96
96 -
 97
97 -
 98
98 -
 99
99 -
 100
100 -
 101
101 -
 102
102 -
103
-
104
-
105
-
106
-
107
-
108
-
109
-
110
-
111
-
112
-
113
-
114
-
115
-
116
-
117
-
118
-
119
-
120
-
121
-
122
-
123
-
124
-
125
-
126
-
127
-
128
-
129
-
130
-
131
-
132
-
133
-
134
-
135
-
136
-
137
-
138
-
139
-
140
-
141
-
142
-
143
-
144
-
145
-
146
-
147
-
148
 |
 |

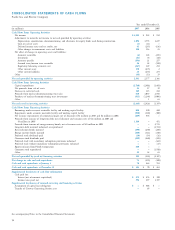
90
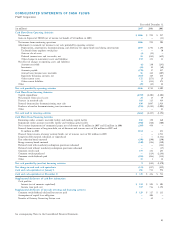
Year ended December 31,
(in millions) 2007 2006 2005
Cash Flows From Operating Activities
Net income $ 1,024 $ 985 $ 934
Adjustments to reconcile net income to net cash provided by operating activities:
Depreciation, amortization, decommissioning, and allowance for equity funds used during construction 1,892 1,755 1,697
Gain on sale of assets (1) (11) —
Deferred income taxes and tax credits, net 43 (287) (636)
Other changes in noncurrent assets and liabilities 188 116 21
Net effect of changes in operating assets and liabilities:
Accounts receivable (6) 128 (245)
Inventories (41) 34 (60)
Accounts payable (196) 21 257
Accrued taxes/income taxes receivable 56 28 (150)
Regulatory balancing accounts, net (567) 329 254
Other current assets 170 (273) 2
Other current liabilities 24 (235) 273
Other (45) (13) 19
Net cash provided by operating activities 2,541 2,577 2,366
Cash Flows From Investing Activities
Capital expenditures (2,768) (2,402) (1,803)
Net proceeds from sale of assets 21 17 39
Decrease in restricted cash 185 115 434
Proceeds from nuclear decommissioning trust sales 830 1,087 2,918
Purchases of nuclear decommissioning trust investments (933) (1,244) (3,008)
Other — 1 61
Net cash used in investing activities (2,665) (2,426) (1,359)
Cash Flows From Financing Activities
Borrowings under accounts receivable facility and working capital facility 850 350 260
Repayments under accounts receivable facility and working capital facility (900) (310) (300)
Net issuance (repayments) of commercial paper, net of discount of $1 million in 2007 and $2 million in 2006 (209) 458 —
Proceeds from issuance of long-term debt, net of discount and issuance costs of $16 million in 2007 and
$3 million in 2005 1,184 — 451
Proceeds from issuance of energy recovery bonds, net of issuance costs of $21 million in 2005 — — 2,711
Long-term debt matured, redeemed, or repurchased — — (1,554)
Rate reduction bonds matured (290) (290) (290)
Energy recovery bonds matured (340) (316) (140)
Preferred stock dividends paid (14) (14) (16)
Common stock dividends paid (509) (460) (445)
Preferred stock with mandatory redemption provisions redeemed — — (122)
Preferred stock without mandatory redemption provisions redeemed — — (37)
Equity infusion from PG&E Corporation 400 — —
Common stock repurchased — — (1,910)
Other 23 38 65
Net cash provided by (used in) fi nancing activities 195 (544) (1,327)
Net change in cash and cash equivalents 71 (393) (320)
Cash and cash equivalents at January 1 70 463 783
Cash and cash equivalents at December 31 $ 141 $ 70 $ 463
Supplemental disclosures of cash fl ow information
Cash paid for:
Interest (net of amounts capitalized) $ 474 $ 476 $ 390
Income taxes paid, net 594 897 1,397
Supplemental disclosures of noncash investing and fi nancing activities
Assumption of capital lease obligation $ — $ 408 $ —
Transfer of Gateway Generating Station asset — 69 —
CONSOLIDATED STATEMENTS OF CASH FLOWS
Pacifi c Gas and Electric Company
See accompanying Notes to the Consolidated Financial Statements.