PG&E 2007 Annual Report Download - page 121
Download and view the complete annual report
Please find page 121 of the 2007 PG&E annual report below. You can navigate through the pages in the report by either clicking on the pages listed below, or by using the keyword search tool below to find specific information within the annual report.-
 1
1 -
2
-
3
-
4
-
5
-
6
-
7
-
8
-
9
-
10
-
11
-
12
-
13
-
14
-
15
-
16
-
17
-
18
-
19
-
20
-
21
-
22
-
23
-
24
-
25
-
26
-
27
-
28
-
29
-
30
-
31
-
32
-
33
-
34
-
35
-
36
-
37
-
38
-
39
-
40
-
41
-
42
-
43
-
44
-
45
-
46
-
47
-
48
-
49
-
50
-
51
-
52
-
53
-
54
-
55
-
56
-
57
-
58
-
59
-
60
-
61
-
62
-
63
-
64
-
65
-
66
-
67
-
68
-
69
-
70
-
71
-
72
-
73
-
74
-
75
-
76
-
77
-
78
-
79
-
80
-
81
-
82
-
83
-
84
-
85
-
86
-
87
-
88
-
89
-
90
-
91
-
92
-
93
-
94
-
95
-
96
-
97
-
98
-
99
-
100
-
101
-
102
-
103
-
104
-
105
-
106
-
107
-
108
-
109
-
110
-
 111
111 -
 112
112 -
 113
113 -
 114
114 -
 115
115 -
 116
116 -
 117
117 -
 118
118 -
 119
119 -
 120
120 -
 121
121 -
 122
122 -
 123
123 -
 124
124 -
 125
125 -
 126
126 -
 127
127 -
 128
128 -
 129
129 -
 130
130 -
 131
131 -
132
-
133
-
134
-
135
-
136
-
137
-
138
-
139
-
140
-
141
-
142
-
143
-
144
-
145
-
146
-
147
-
148
 |
 |

119
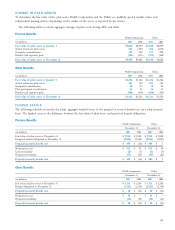
CHANGE IN PLAN ASSETS
To determine the fair value of the plan assets, PG&E Corporation and the Utility use publicly quoted market values and
independent pricing services depending on the nature of the assets, as reported by the trustee.
The following tables reconcile aggregate changes in plan assets during 2007 and 2006:
Pension Benefi ts
PG&E Corporation Utility
(in millions) 2007 2006 2007 2006
Fair value of plan assets at January 1 $9,028 $8,049 $9,028 $8,049
Actual return on plan assets 766 1,050 766 1,050
Company contributions 139 300 137 298
Benefi ts and expenses paid (393) (371) (391) (369)
Fair value of plan assets at December 31 $9,540 $9,028 $9,540 $9,028
Other Benefi ts
PG&E Corporation Utility
(in millions) 2007 2006 2007 2006
Fair value of plan assets at January 1 $1,256 $1,146 $1,256 $1,146
Actual return on plan assets 107 154 107 154
Company contributions 38 25 38 25
Plan participant contribution 36 31 36 31
Benefi ts and expenses paid (106) (100) (106) (100)
Fair value of plan assets at December 31 $1,331 $1,256 $1,331 $1,256
FUNDED STATUS
The following schedule reconciles the plans’ aggregate funded status to the prepaid or accrued benefi t cost on a plan sponsor
basis. The funded status is the difference between the fair value of plan assets and projected benefi t obligations.
Pension Benefi ts
PG&E Corporation Utility
December 31, December 31,
(in millions) 2007 2006 2007 2006
Fair value of plan assets at December 31 $ 9,540 $ 9,028 $ 9,540 $ 9,028
Projected benefi t obligation at December 31 (9,081) (9,064) (9,036) (9,023)
Prepaid/(accrued) benefi t cost $ 459 $ (36) $ 504 $ 5
Noncurrent asset $ 532 $ 34 $ 532 $ 34
Current liability (2) (5) (3) (3)
Noncurrent liability (71) (65) (25) (26)
Prepaid/(accrued) benefi t cost $ 459 $ (36) $ 504 $ 5
Other Benefi ts
PG&E Corporation Utility
December 31, December 31,
(in millions) 2007 2006 2007 2006
Fair value of plan assets at December 31 $ 1,331 $ 1,256 $ 1,331 $ 1,256
Benefi t obligation at December 31 (1,311) (1,310) (1,311) (1,310)
Prepaid/(accrued) benefi t cost $ 20 $ (54) $ 20 $ (54)
Noncurrent asset $ 54 $ — $ 54 $ —
Noncurrent liability (34) (54) (34) (54)
Prepaid/(accrued) benefi t cost $ 20 $ (54) $ 20 $ (54)