PG&E 2007 Annual Report Download - page 84
Download and view the complete annual report
Please find page 84 of the 2007 PG&E annual report below. You can navigate through the pages in the report by either clicking on the pages listed below, or by using the keyword search tool below to find specific information within the annual report.-
 1
1 -
2
-
3
-
4
-
5
-
6
-
7
-
8
-
9
-
10
-
11
-
12
-
13
-
14
-
15
-
16
-
17
-
18
-
19
-
20
-
21
-
22
-
23
-
24
-
25
-
26
-
27
-
28
-
29
-
30
-
31
-
32
-
33
-
34
-
35
-
36
-
37
-
38
-
39
-
40
-
41
-
42
-
43
-
44
-
45
-
46
-
47
-
48
-
49
-
50
-
51
-
52
-
53
-
54
-
55
-
56
-
57
-
58
-
59
-
60
-
61
-
62
-
63
-
64
-
65
-
66
-
67
-
68
-
69
-
70
-
71
-
72
-
73
-
 74
74 -
 75
75 -
 76
76 -
 77
77 -
 78
78 -
 79
79 -
 80
80 -
 81
81 -
 82
82 -
 83
83 -
 84
84 -
 85
85 -
 86
86 -
 87
87 -
 88
88 -
 89
89 -
 90
90 -
 91
91 -
 92
92 -
 93
93 -
 94
94 -
95
-
96
-
97
-
98
-
99
-
100
-
101
-
102
-
103
-
104
-
105
-
106
-
107
-
108
-
109
-
110
-
111
-
112
-
113
-
114
-
115
-
116
-
117
-
118
-
119
-
120
-
121
-
122
-
123
-
124
-
125
-
126
-
127
-
128
-
129
-
130
-
131
-
132
-
133
-
134
-
135
-
136
-
137
-
138
-
139
-
140
-
141
-
142
-
143
-
144
-
145
-
146
-
147
-
148
 |
 |

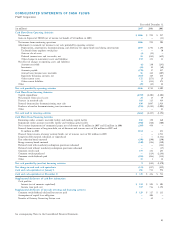
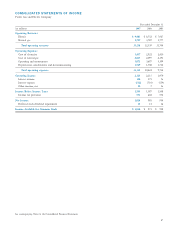
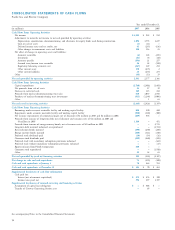
82
Year ended December 31,
(in millions, except per share amounts) 2007 2006 2005
Operating Revenues
Electric $ 9,480 $ 8,752 $ 7,927
Natural gas 3,757 3,787 3,776
Total operating revenues 13,237 12,539 11,703
Operating Expenses
Cost of electricity 3,437 2,922 2,410
Cost of natural gas 2,035 2,097 2,191
Operating and maintenance 3,881 3,703 3,397
Depreciation, amortization, and decommissioning 1,770 1,709 1,735
Total operating expenses 11,123 10,431 9,733
Operating Income 2,114 2,108 1,970
Interest income 164 188 80
Interest expense (762) (738) (583)
Other income (expense), net 29 (13) (19)
Income Before Income Taxes 1,545 1,545 1,448
Income tax provision 539 554 544
Income From Continuing Operations 1,006 991 904
Discontinued Operations
Gain on disposal of NEGT (net of income tax benefi t of $13 million in 2005) — — 13
Net Income $ 1,006 $ 991 $ 917
Weighted Average Common Shares Outstanding, Basic 351 346 372
Weighted Average Common Shares Outstanding, Diluted 353 349 378
Earnings Per Common Share from Continuing Operations, Basic $ 2.79 $ 2.78 $ 2.37
Net Earnings Per Common Share, Basic $ 2.79 $ 2.78 $ 2.40
Earnings Per Common Share from Continuing Operations, Diluted $ 2.78 $ 2.76 $ 2.34
Net Earnings Per Common Share, Diluted $ 2.78 $ 2.76 $ 2.37
Dividends Declared Per Common Share $ 1.44 $ 1.32 $ 1.23
CONSOLIDATED STATEMENTS OF INCOME
PG&E Corporation
See accompanying Notes to the Consolidated Financial Statements.